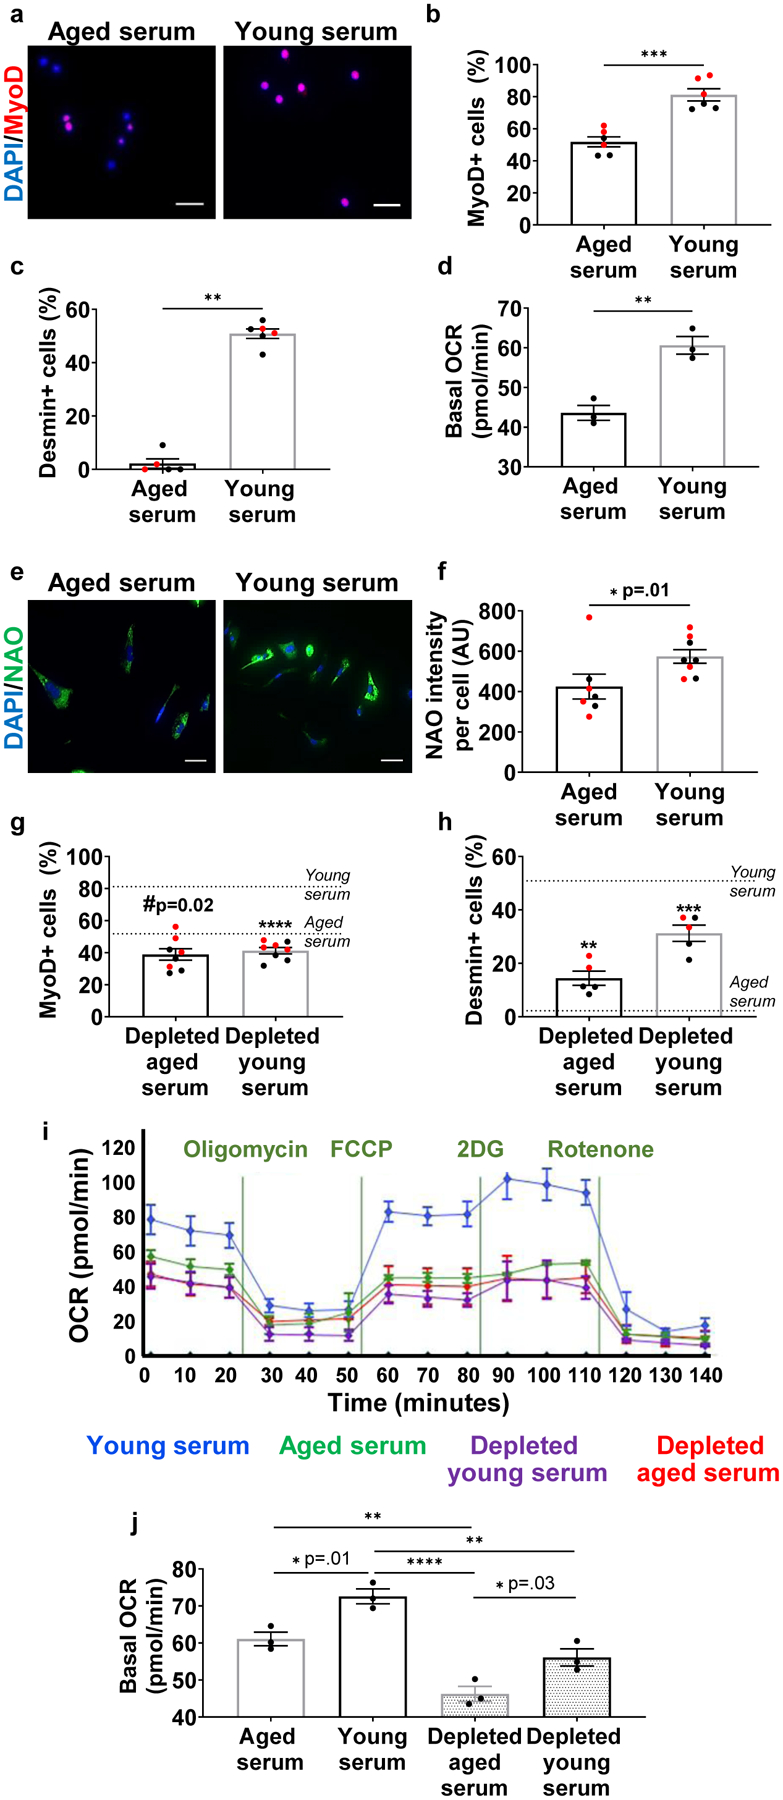
Fig. 1. The beneficial effect of young serum on aged muscle progenitors is dependent on circulating EVs.

a, Immunofluorescent imaging of MyoD (red) and nuclei (DAPI; blue) in aged MPCs cultured with serum from aged or young mice. Scale: 25 μm. Quantification of b, MyoD and c, desmin (b: ***p < 0.0001, two-tailed Welch’s t-test, n=6 wells/group. c: **p<0.01, two-tailed Mann-Whitney test, n=5 wells/group). d, Quantification of oxygen consumption rates (OCR) of MPCs cultured in the presence of aged or young serum. The experiment was repeated in triplicate. Data presented were taken from one representative experiment (**p<0.01, two-tailed Student’s t test, 3–4 wells/group averaged over n=3 time points prior to oligomycin treatment). e, Immunofluorescent imaging and f, quantification of cardiolipin (NAO; green) and nuclei (DAPI; blue) in aged MPCs cultured with young or aged serum. Scale bar: 50 μm (*p < 0.05, two-tailed Mann Whitney test, n=7 (aged serum), 8 (young serum) wells). Quantification of g, MyoD (#p<0.05, ****p<0.0001 when compared to age-matched controls from figure 1B, two-tailed student’s t-test, n=8 wells/group) and h, desmin (**p<0.05, ***p<0.001 when compared to age-matched controls from figure 1c, two-tailed student’s t-test, n=5 wells/group) in cells treated with young or aged serum depleted of EVs. i, Representative bioenergetic profiles of aged cells treated with young or aged serum with or without EVs (n=3 independent experiments). j, Seahorse analysis of aged MPCs treated with young and aged serum depleted of EVs (*p<0.05, **p<0.01, ****p<0.0001, one-way ANOVA with Tukey’s multiple comparisons). Data presented as mean ± SEM of n=3 time points prior to oligomycin treatment, performed in 4–8 wells/group, as shown in figure 1i. The experiment was repeated in triplicate, and one experimental set of data is presented. Data are presented as mean ± SEM. Data from different cohorts or experimental groups performed on different days are presented within the same graph as black or red circles.
