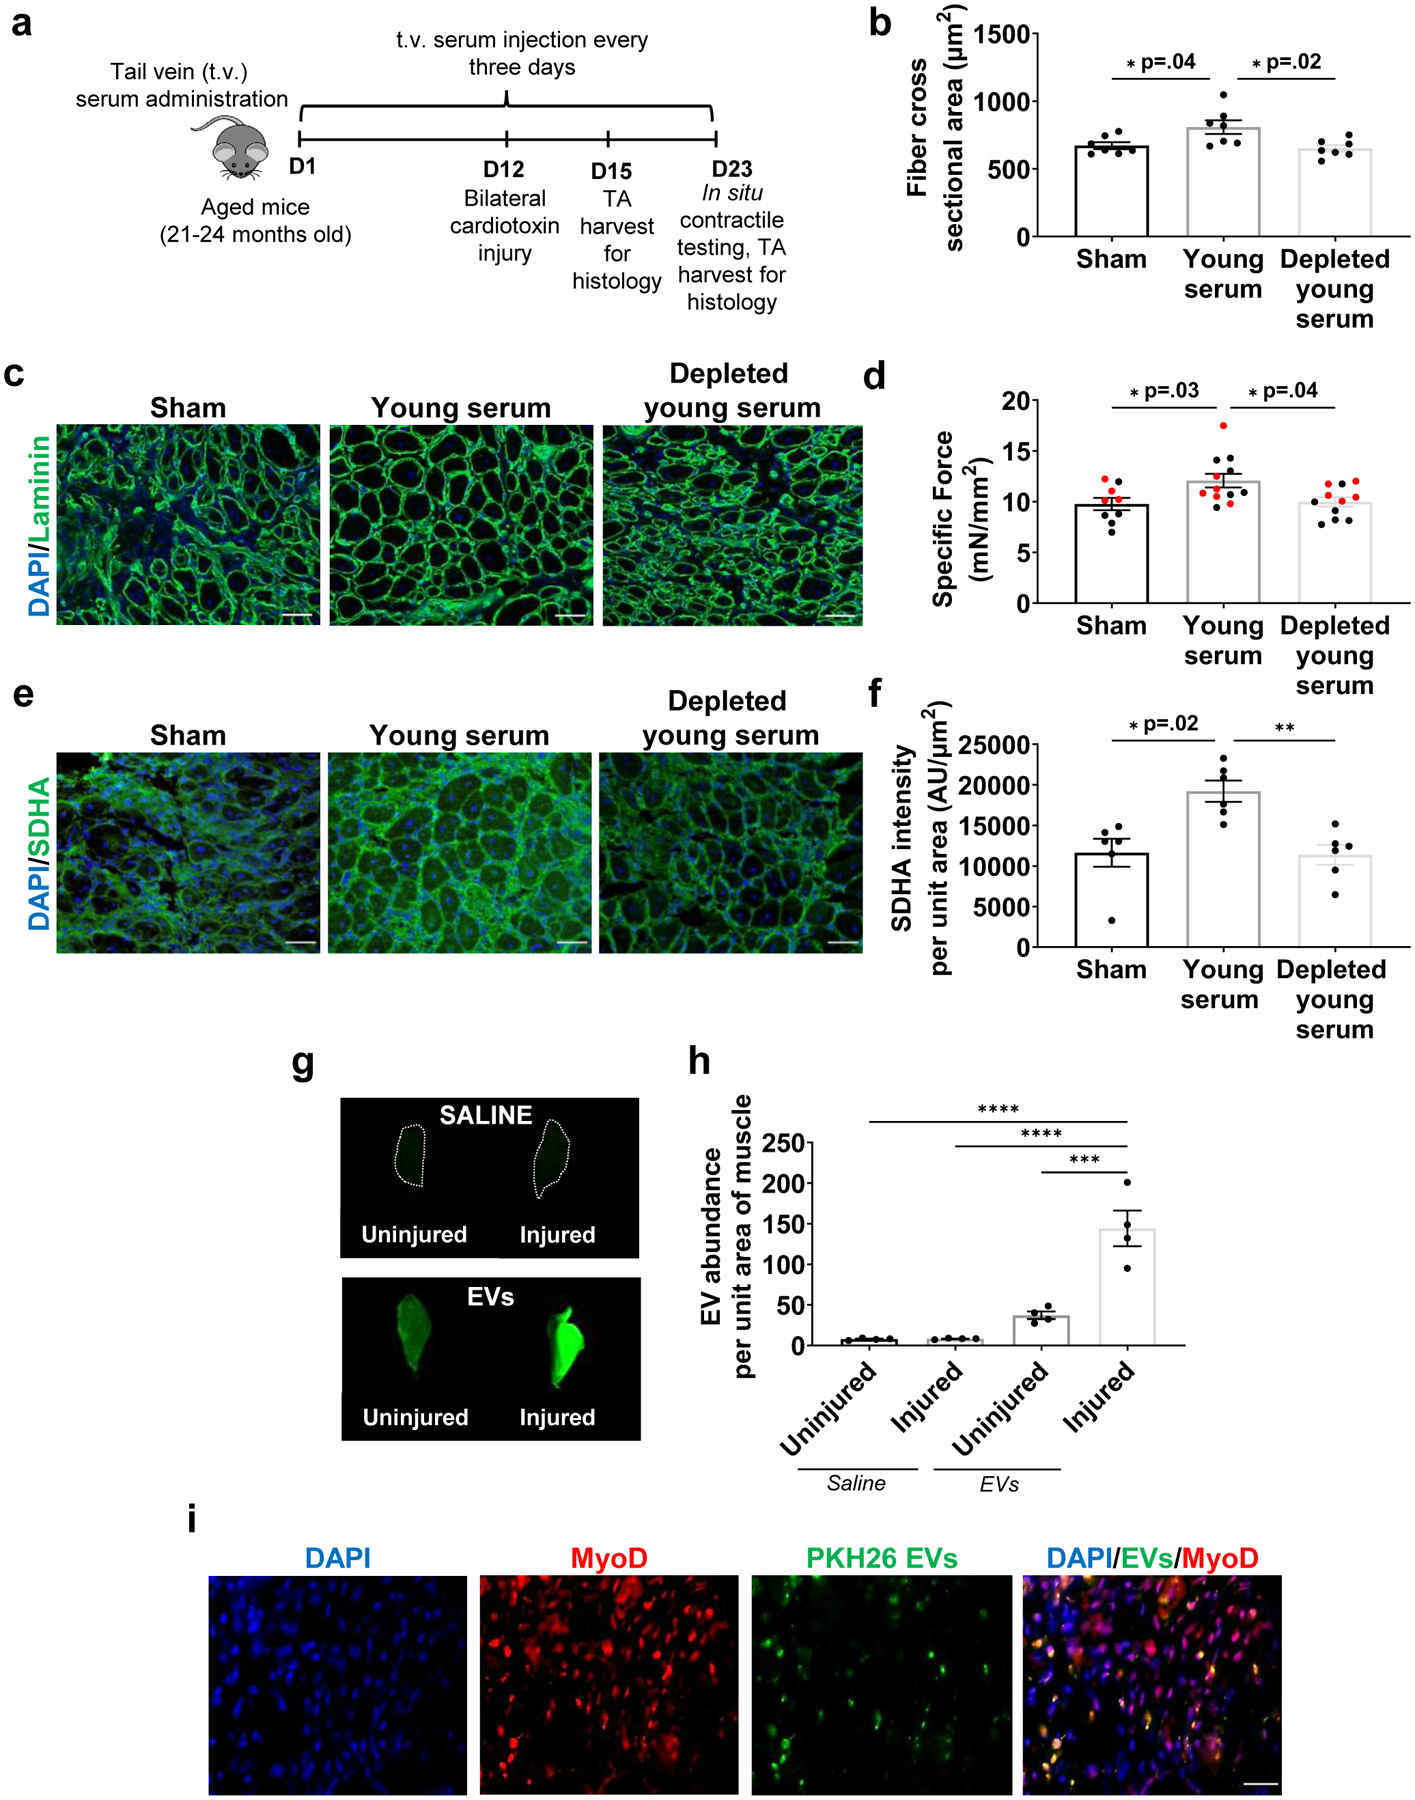
Fig. 2. The beneficial effect of young serum on aged muscle regeneration and mitochondrial function is dependent, at least in part, on circulating EVs.

a, Schematic of the experimental paradigm for muscle functional recovery after serum injections. b, Quantification and c, representation of cross-sectional area of muscle fibers (Laminin; green) and nuclei (DAPI; blue). Scale: 50 μm. (*p<0.05, n=7/group, one-way ANOVA with Tukey’s multiple comparisons). d, Comparison of peak specific force across the three experimental groups (*p<0.05, n=9 (Sham), 11 (Young serum), 12 (Depleted young serum), one-way ANOVA with Tukey’s multiple comparisons). e, Representation and f, quantification of SDHA in regenerating myofibers of injured muscles receiving sham, young serum, or EV-depleted young serum treatments. (SDHA; green) and nuclei (DAPI; blue) (*p<0.05, **p<0.01, n=6/group, non-parametric ANOVA with Dunn’s multiple comparisons). g, LiCOR imaging and h, quantification of intensity of labeled EVs in uninjured and injured TAs receiving saline or dyed EVs in the circulation. The experiment was repeated in duplicate. i, Quantification of intensity of labeled EVs in muscle using scanned images of TA muscles by LiCOR Odyssey equipment. (****p<0.0001, one-way ANOVA with Tukey’s multiple comparisons, n=4/group). i, Representative image of MyoD+ cells co-localizing with PKH26 dyed EVs at the site of injury 48 hours after EV injection. The immunofluorescence staining was repeated in duplicate by two independent investigators. Scale: 25 μm. Data presented as mean ± SEM. Data from different cohorts or experimental groups performed on different days are presented within the same graph as black or red circles.
