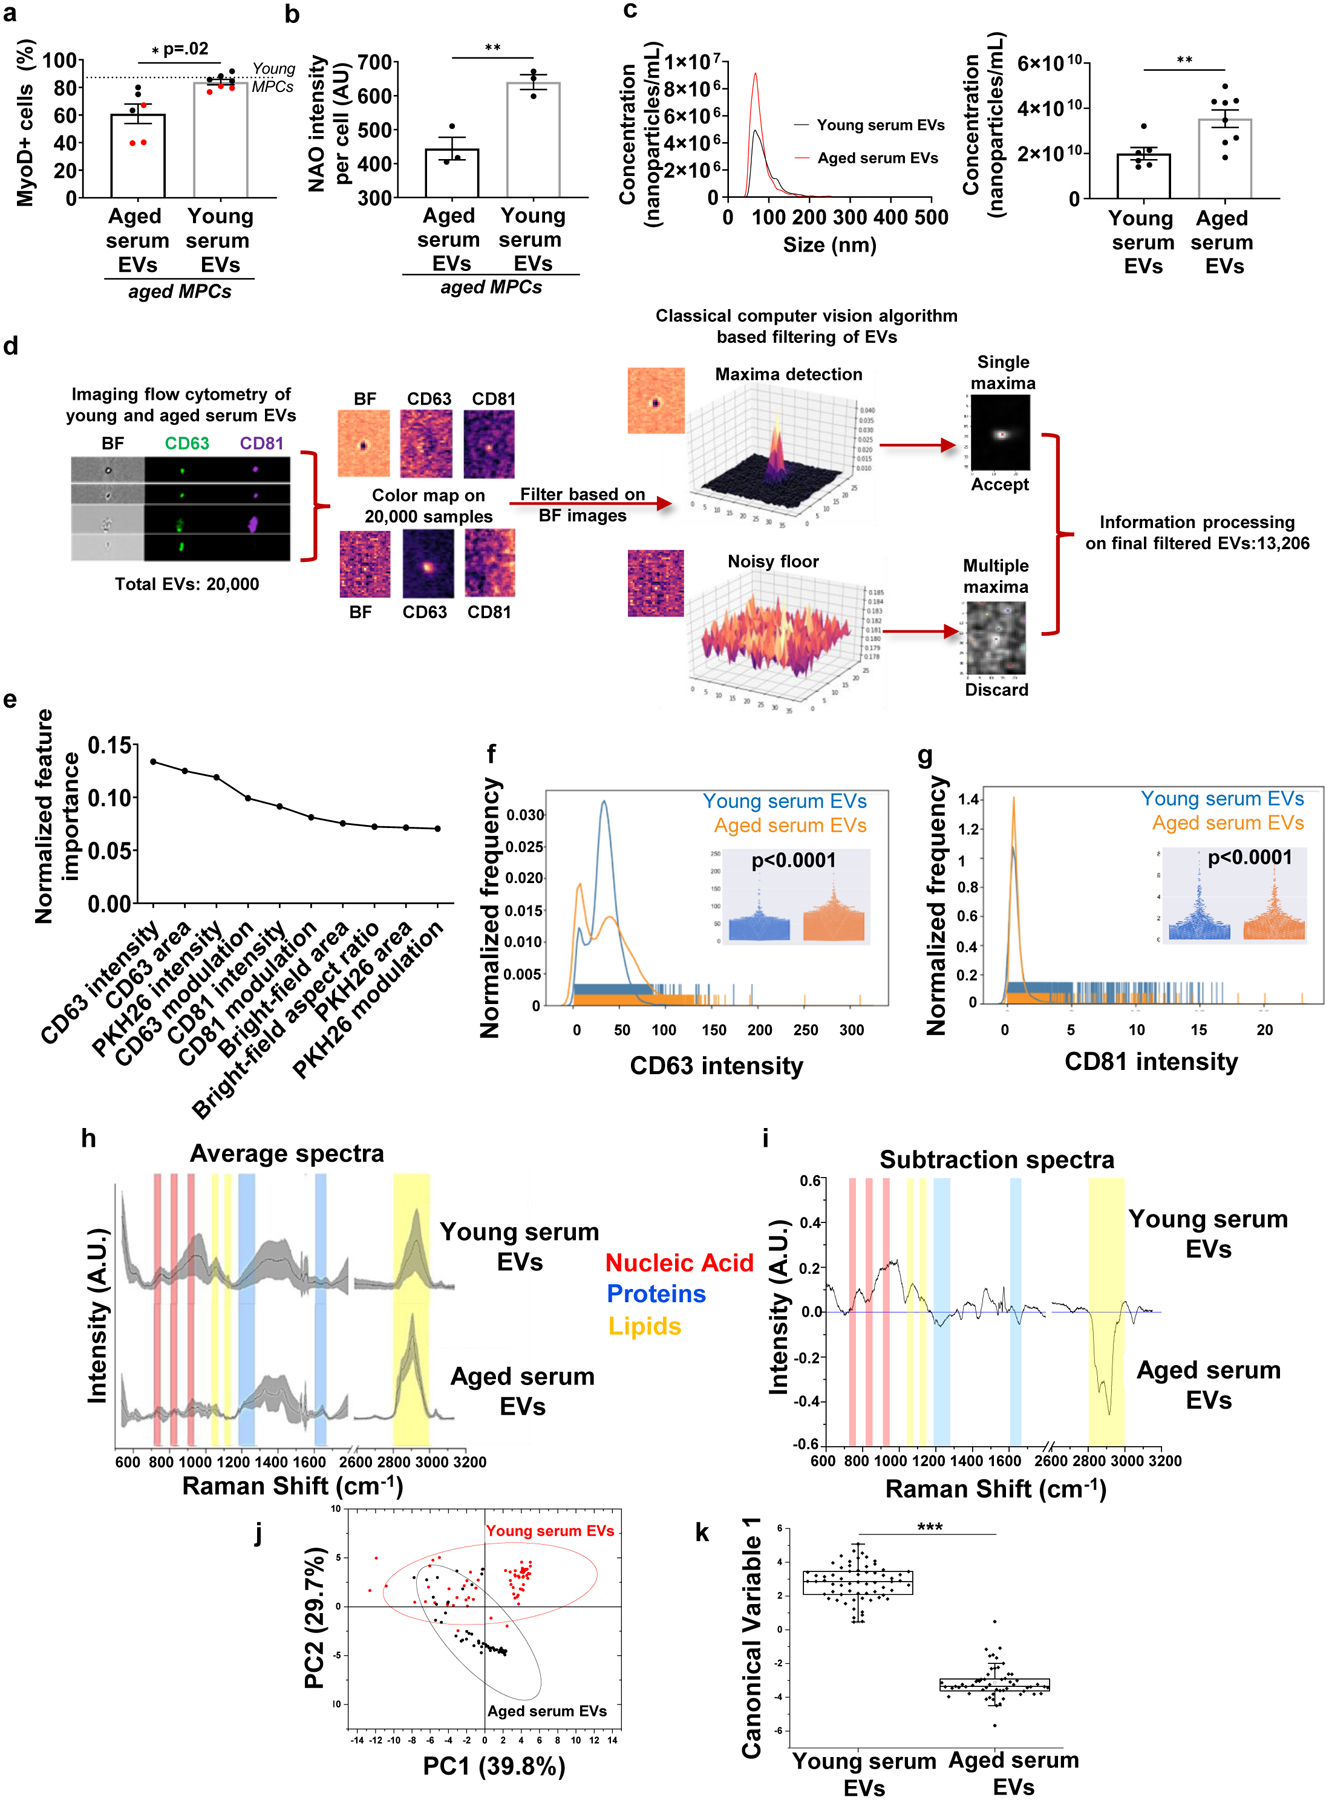
Fig. 3. Aging shifts EV subpopulation heterogeneity and disrupts the biochemical fingerprint of EVs.

a, Quantification of MyoD-positive aged MPCs treated with young or aged serum EVs (*p<0.05, two-tailed Welch’s t-test, n=6 (Aged),7(Young) wells). b, Quantification of cardiolipin content (NAO) of aged MPCs following exposure to young or aged EVs (**p<0.01, two-tailed Student’s t-test, 3 wells/group, data representative of two independent experiments). c, Representative histogram and quantification of nanoparticle concentration in young and aged serum EVs (**p<0.01, two-tailed Welch’s test, n=6 (Young), 8 (Aged) samples). d, Classical computer vision-based filtering of imaging flow cytometry images of EVs based on the bright-field channel. e, Elbow plot of gradient-boosted decision tree classifier derived feature importance ranks to discriminate EVs based on age. Features used were based on size (area, aspect ratio), signal strength (intensity) and texture (modulation) of the EVs in the bright-field, CD63, CD81 and PKH26 image channels. Rug plots and beeswarm plots (inset) for f, CD63 intensity (p<0.0001, n=6417–13077 EVs per group for this experimental run, EVs pooled from 4 serum samples of both young and aged animals, two-tailed Mann Whitney test, experiment repeated in triplicates) and g, CD81 intensity for young and aged serum EVs. (p<0.0001, n=6417 (young),13077 (aged) EVs for this experimental run, EVs pooled from 4 serum samples of both young and aged animals, two-tailed Mann Whitney test, experiment repeated in triplicates). h, Average Raman spectra with standard deviation (grey band) of young and aged serum EVs. i, Subtraction spectrum of the differences between the average spectra acquired for young and aged serum EVs. j, Principal Component Analysis (PCA) with 95% confidence interval and k, Linear Discriminant Analysis of spectra data acquired from aged and young serum EVs (n=5 samples/group; ***p<0.001, two-tailed Mann Whitney test). Minima, maxima, median, 25th percentile and 75th percentile: 0.46324, 5.082, 2.85669, 2.09799, 3.45523 (young serum EVs); −5.67133, 0.48193, −3.35317, −3.60656 and −2.9319 (aged serum EVs). Boundaries determined using inter-quartile range with 1.5 as coefficient: 1.35723 for young serum EVs and 0.67466 for aged serum EVs.
Data presented as mean ± SEM.
