
Fig. 6. EV age impacts skeletal muscle regeneration and function.
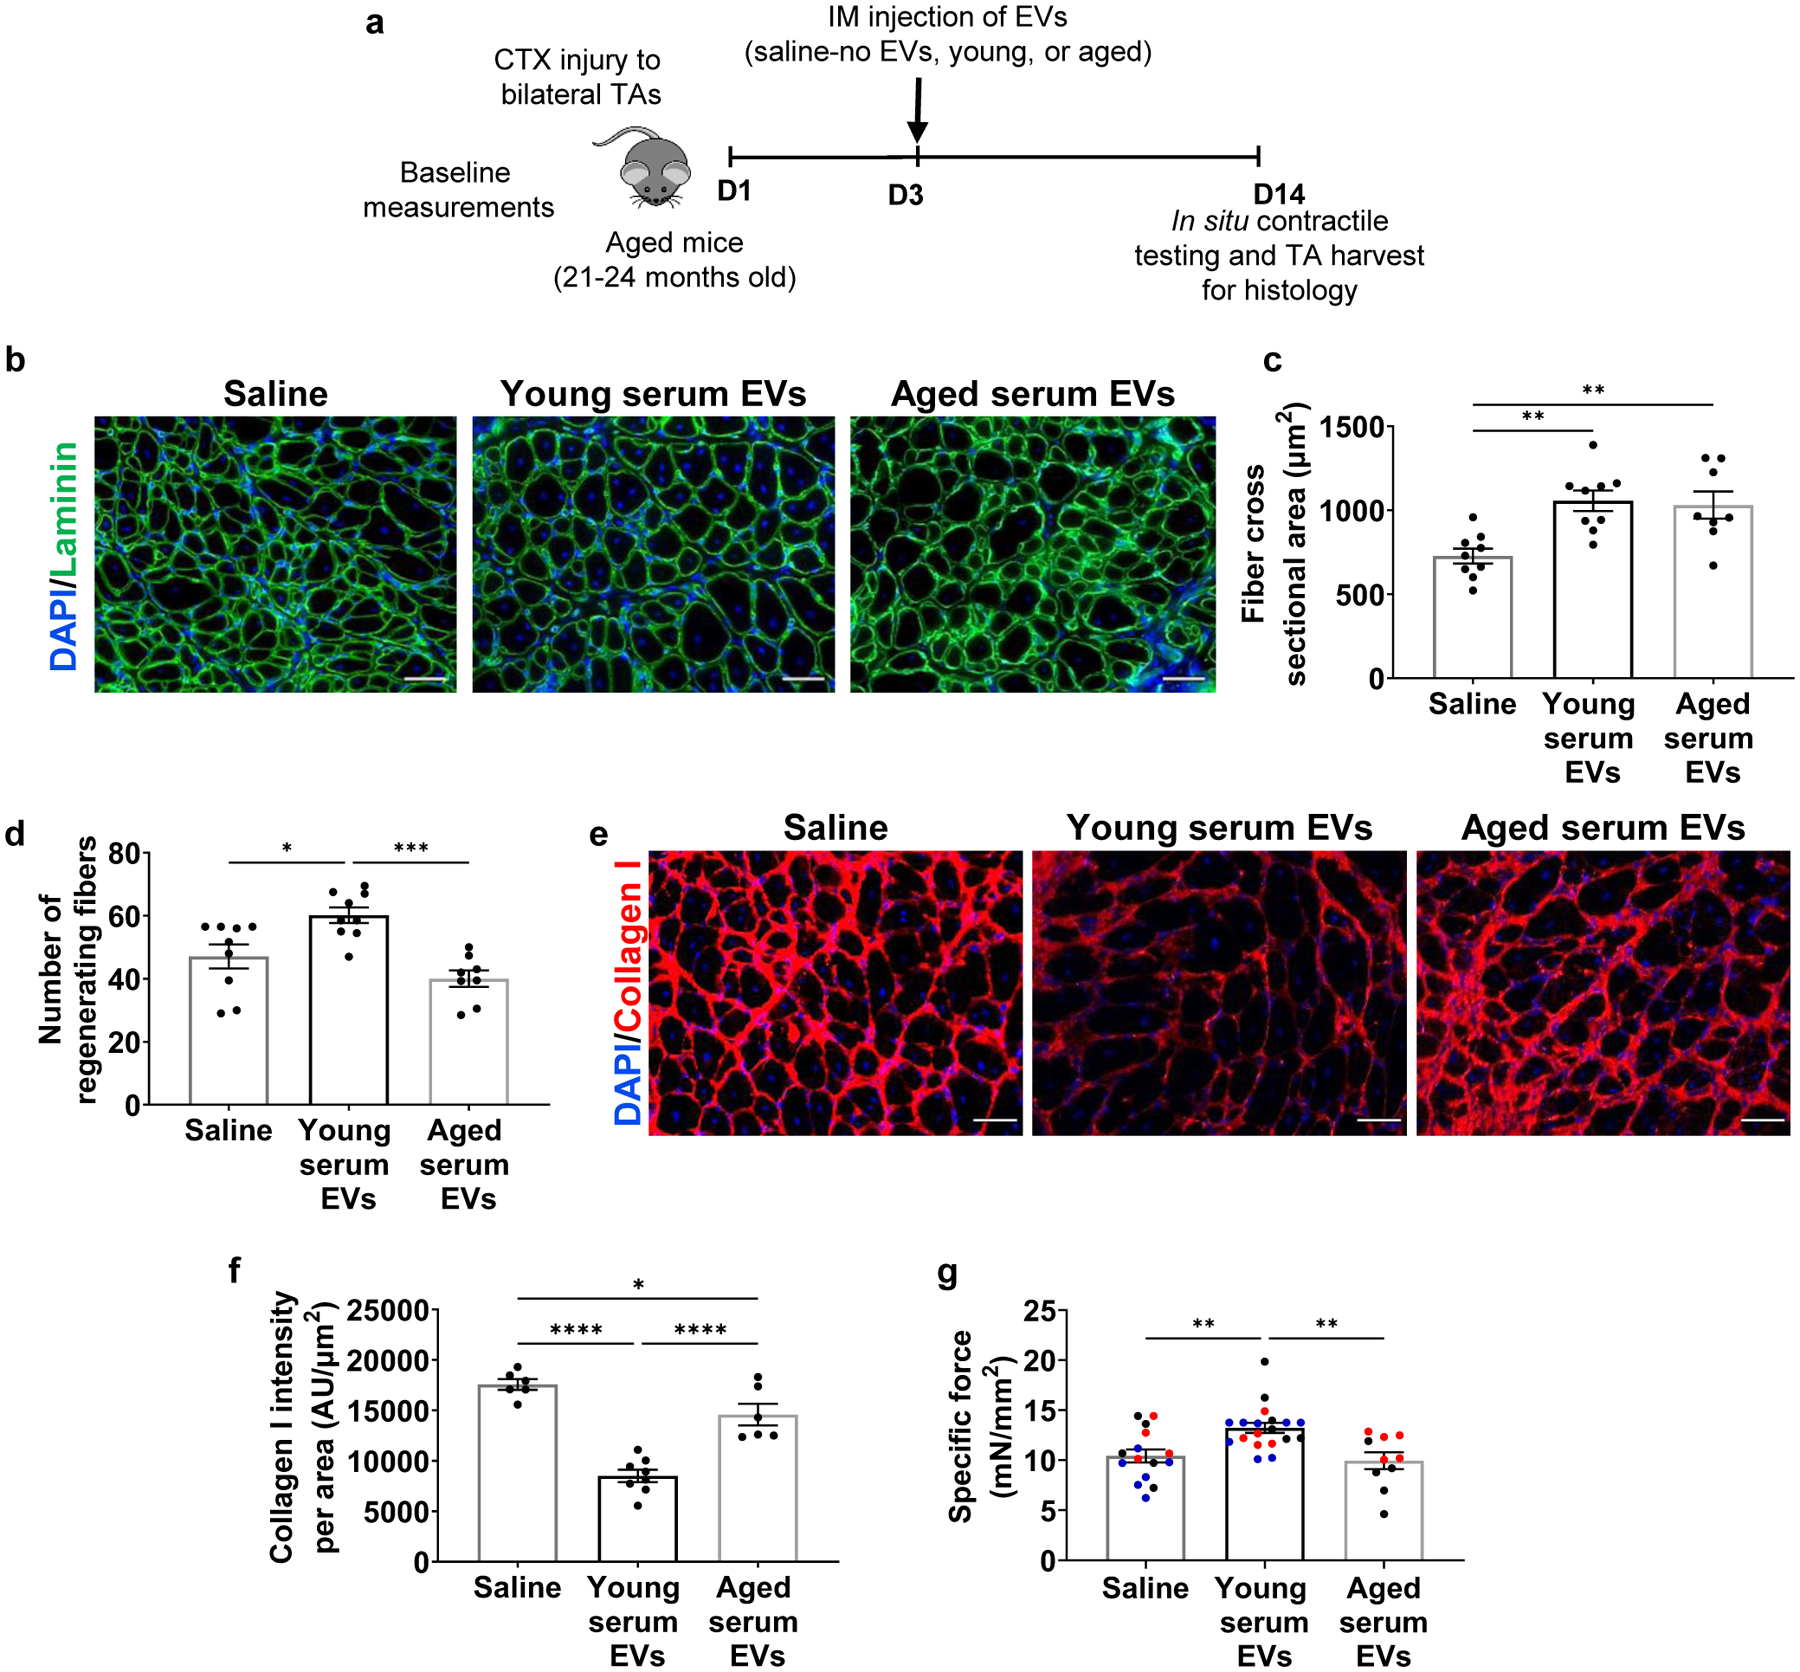
a, Schematic of the in vivo administration of EVs to injured aged mice. b, Representative images of laminin (green) and c, histological analysis of fiber cross-sectional area of injured TAs of aged mice receiving saline, young, or aged EVs. (**p<0.01, one-way ANOVA with Tukey’s multiple comparisons, n=8–9/group). Scale: 50 μm. d, Quantification of number of regenerating fibers in injured TAs of aged mice receiving saline, young serum EVs, or aged serum EVs (***p<0.001, *p<0.01, one-way ANOVA with Tukey’s multiple comparisons, n=8 (aged), 9 (saline, young)). e, Representative images of Collagen I in injured muscle cross-sections of aged mice receiving saline, young, or aged EVs. f, Histological analysis of Collagen I in injured muscle cross-sections of aged mice receiving young or aged EVs when compared to saline-injected controls (*p<0.05, ****p<.0001, one-way ANOVA with Tukey’s multiple comparisons, n=6 (saline, aged), 8 (young)). Scale: 50 μm. g, Specific tetanic force of aged animals receiving intramuscular injections of saline, young, or aged EVs. (**p<0.01, one-way ANOVA with Tukey’s multiple comparison, n=10 (aged), 15 (saline), 19 (young)). Data presented as mean ± SEM. Data from different cohorts or experimental groups performed on different days are presented within the same graph as black, blue, or red circles.