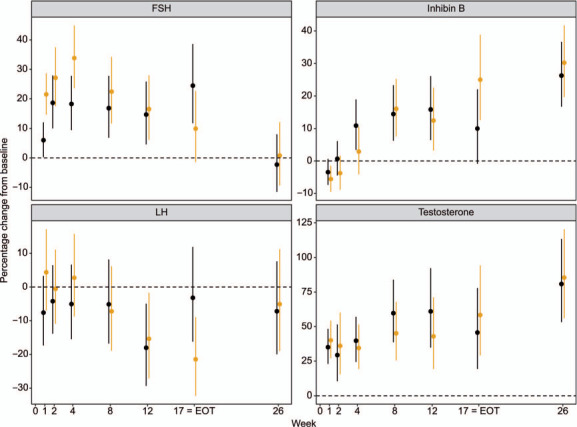
Figure.

NC-006: percentage change in hormones from baseline comparing Pa100MfxZ-17 weeks (drug-susceptible TB) vs. PA200MfxZ-17 weeks (drug-susceptible TB). Dots are point estimates and vertical lines span 95% confidence intervals. Black lines = Pa100MZ; gold lines = Pa200MZ; FSH = follicle stimulating hormone; LH = luteinizing hormone; EOT =end-of-treatment.
