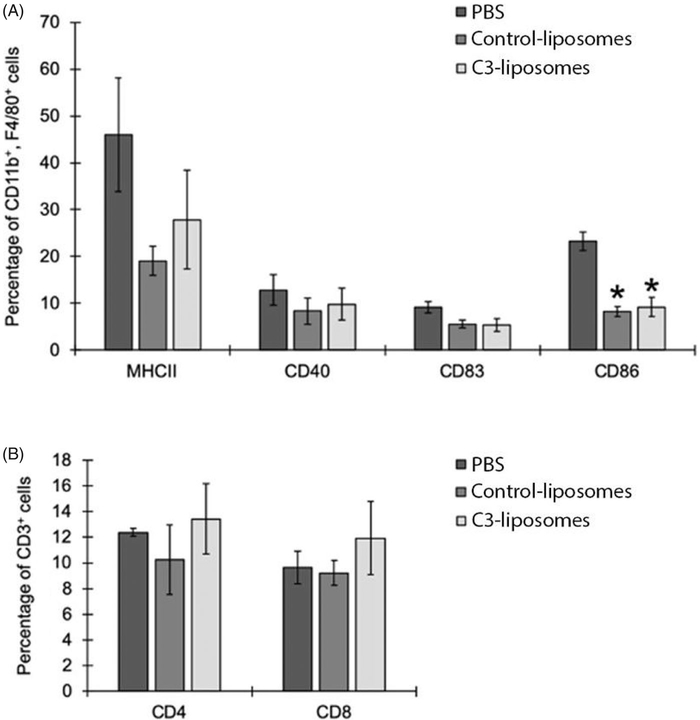
Figure 4.
Analysis of immune cell tumour infiltrate. Mice were euthanised, injected tumours digested, and cells analysed by flow cytometry. (A) Percentages of macrophages (CD11b+, F4/80+) expressing activation markers (MHCII, CD40, CD83, CD86), and (B) percentages of CD3+ T cells (either CD4+ or CD8+) in injected tumours treated with PBS, control-liposomes, or C3-liposomes. Cell populations are displayed as percentages of the total number of white blood cells. Data are expressed as mean ± standard error (n = 3–4). *p Value < .05, compared to PBS.

