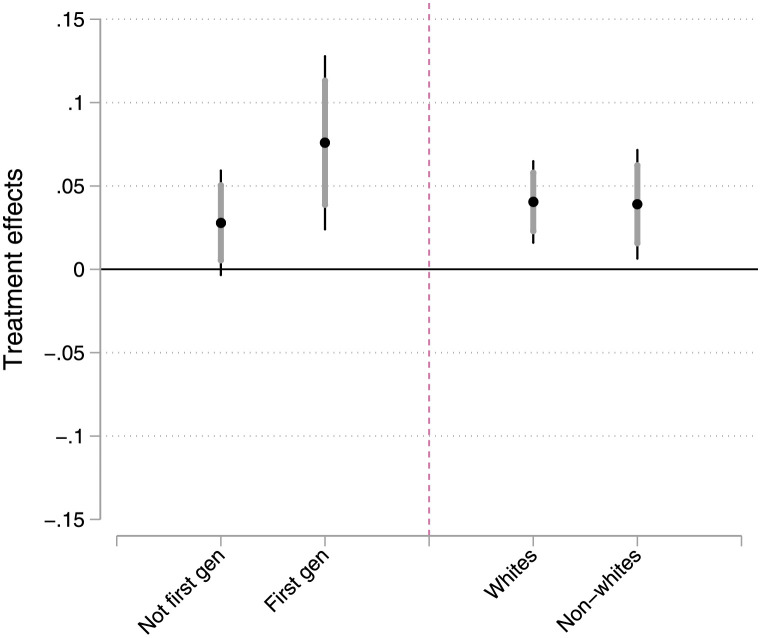
Fig 1. Treatment effects by first-generation status and race/ethnicity.
Plot shows point estimates for difference of proportions tests comparing students in lottery email condition to those in encouragement email condition. Thin vertical lines are 95% confidence intervals while thick vertical lines are 84% confidence intervals. If 84% confidence intervals do not overlap, we can be 95% confident that the two estimates are different.

