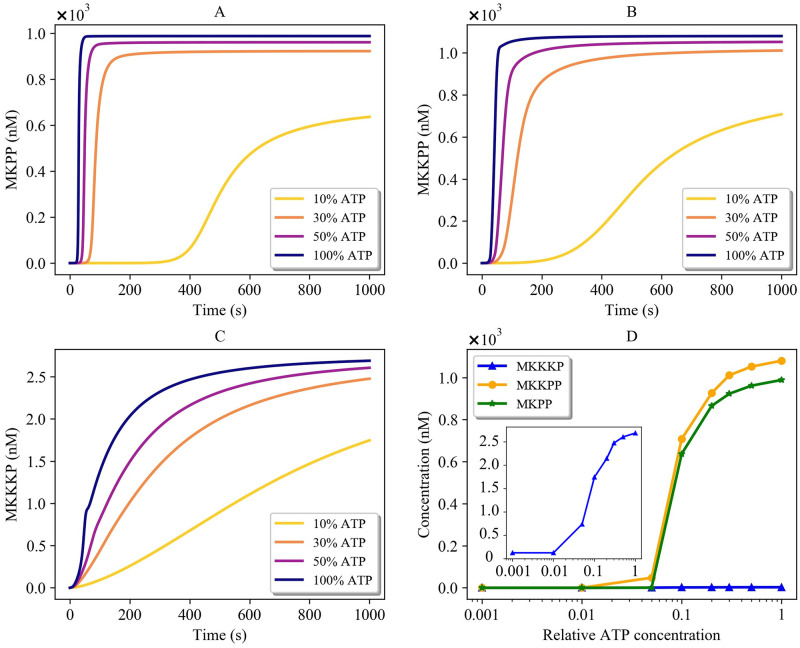
Fig 17. Effect of different levels of ATP concentration on activated kinases in the composed EGFR-Ras-MAPK bond graph model.
(A) MKPP; (B) MKKPP; (C) MKKKP; (D) Steady-state concentration of MKKKP, MKKPP, and MKPP against relative ATP concentration. MKKKP concentration is also separately shown in a box due to its relatively small amounts compared to MKKPP and MKPP (initial concentration of common species: Ras = 0, RShGS = 0).

