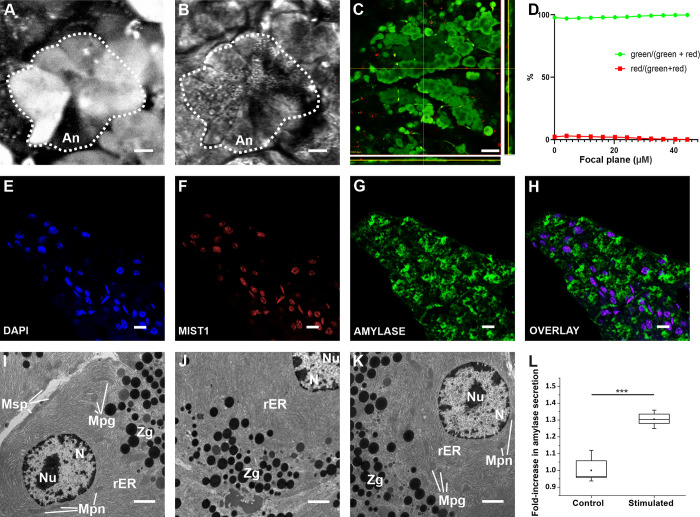
Fig 2. Morphology of acinar cells in mouse pancreas tissue slices.
(A, B) High resolution confocal fluorescence images of the exocrine part of the pancreas, labeled with OGB-1 (A) and imaged with Dodt contrast (B). An; acinus is encircled by the broken line. Scale bar 10 μm. (C) A layer from a z-stack, cells were loaded with the Live/Dead dye. Side panels represent orthogonal projections of the z-stack, positioned as indicated by yellow lines. Pseudo color-coded, such that green indicates live cells and red indicates dead cells. Scale bar 50 μm. (D) The percentage of live cells in green and dead cells in red, as a function of depth of the focal plane within the slice. (E, F, G, H) Staining of nuclei with DAPI (E) and anti-Mist1 antibodies (F), and of cytoplasm with anti-amylase antibodies (G), with the overlay (H). Scale bar 10 μm. (I-K) TEM images of acinar cells from a tissue slice. Mpn, perinuclear mitochondria; Mpg, perigranular mitochondria; Msp, subplasmalemmal mitochondria; Zg, zymogen granules; N, nucleus; Nu, nucleolus; rER, rough endoplasmic reticulum. Scale bar 10 μm. (L) Quantification of amylase secretion upon stimulation by 0.1 nM cerulein, n = 6. Significant difference is indicted by asterisks (***, p<0.001).

