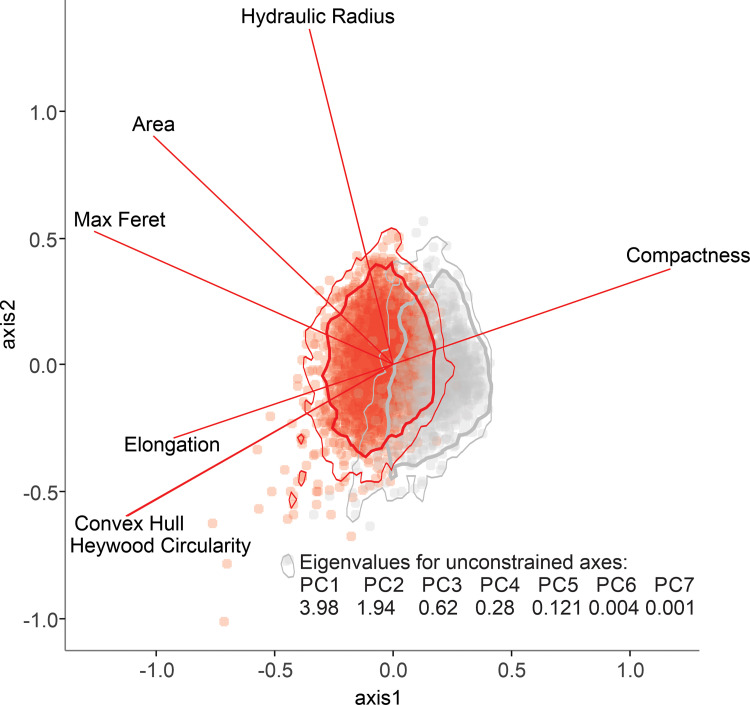
Fig 9. Principal component analysis of the seven core parameters for Leptospermum scoparium and Kunzea pollen in polar view.
Polygons show the highest posterior density region for each species, thick lines = 95% range, thin lines = 99% range, calculated using R package coda [44].

