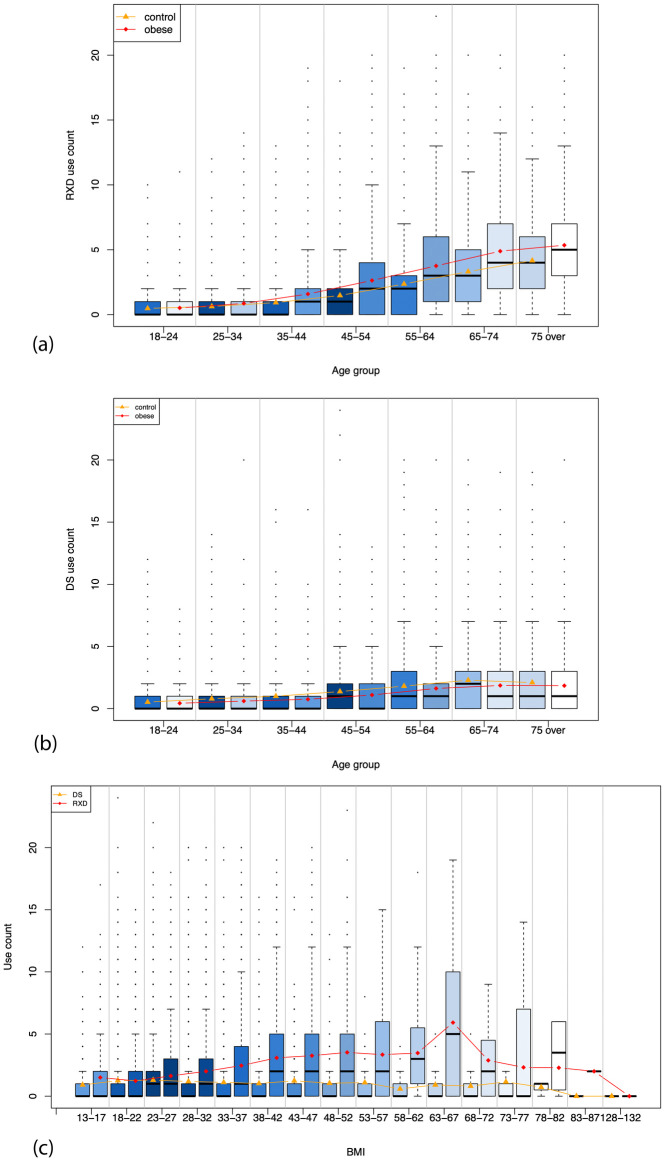
Fig 2. (a) The correlation between the number of RXD used and age; (b) The correlation between the number of DS used and age; (c) the number of RXD/DS used compared to BMI.
The shade of color represents the aggregated weights within each age group. The points of line indicate the average number used within each age group. The shade of the color represents the aggregated weights within each age group. The points on the line indicate the average number used within each age group.

