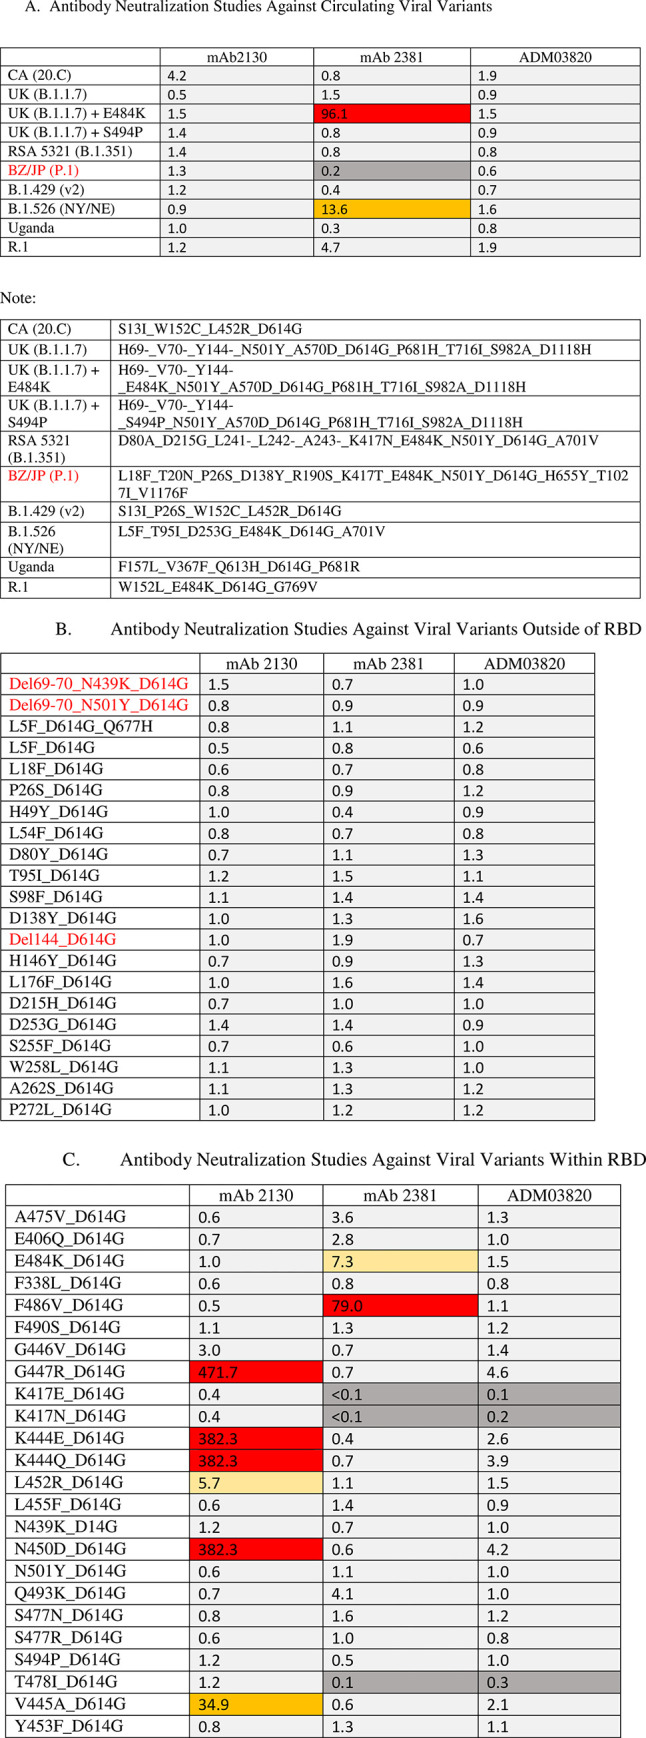
Fig 1. Viral neutralization studies.

The results of the viral variant testing. Heat map represents activity as measured by the average ratio of the mutation IC50/wild type (D614G). Ratios are provided in the Figures. The average is calculated from multiple experiments so specific mutation IC50 and WT IC50 are not provided. IC50 (dark grey represents <0.3; light grey represents 0.3–5.0; yellow represents 5.0–10.0; orange represents 10.0–50.0; red represents >50.0). (A) Neutralization results against VOCs; (B) Neutralization results against a panel of mutant variants of the non-RBD, (C) Neutralization results against a panel of mutant variants of the RBD.
