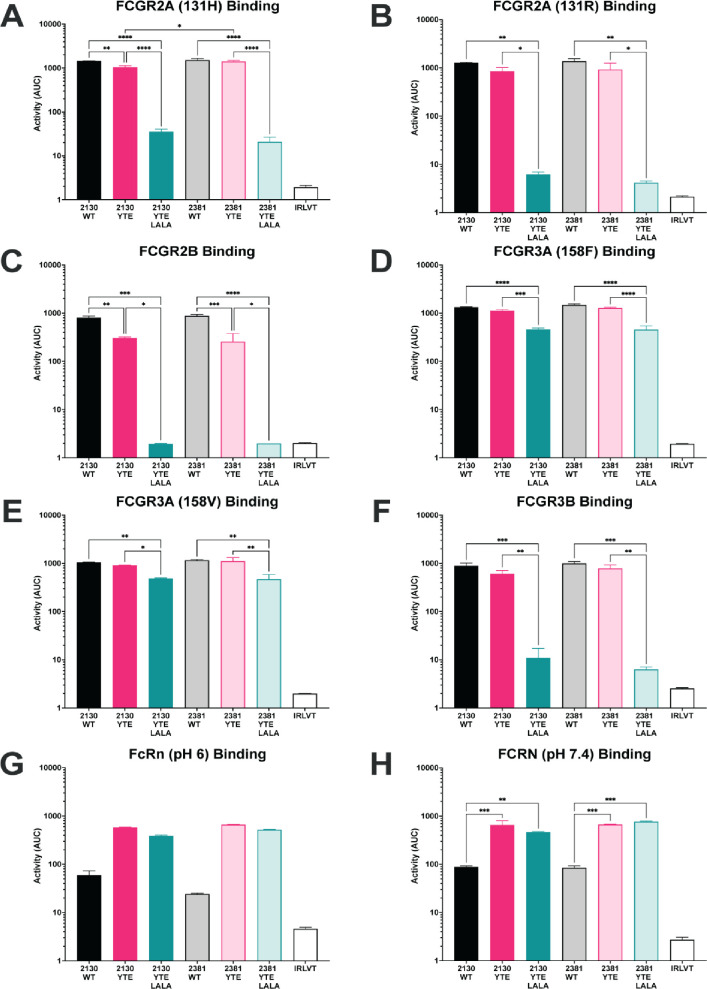
Fig 2. Binding of the monoclonal antibody variants to Fc receptors.
The bar graphs present the overall binding of the monoclonal antibody variants to the indicated Fc receptor represented as the area under the curve calculated from the dilution curves presented in S1 Fig. Data are presented as the mean AUC ± standard deviation from two independent experiments. (A) FCGR2A 131H; (B) FCGR2A 131R; (C) FCGR2B; (D) FCGR3A 158F; (E) FCGR3A 158V; (F) FCGR3B; (G) FCRN pH6; (H) FCRN pH 7.4. The Ebola virus GP–specific antibody KZ52 was used as the irrelevant antibody. Significance was calculated using a one-way ANOVA with post hoc Holm-Šídák’s multiple comparisons test. *: p ≤ 0.05; ** p < 0.01; *** p < 0.001; **** p < 0.0001.

