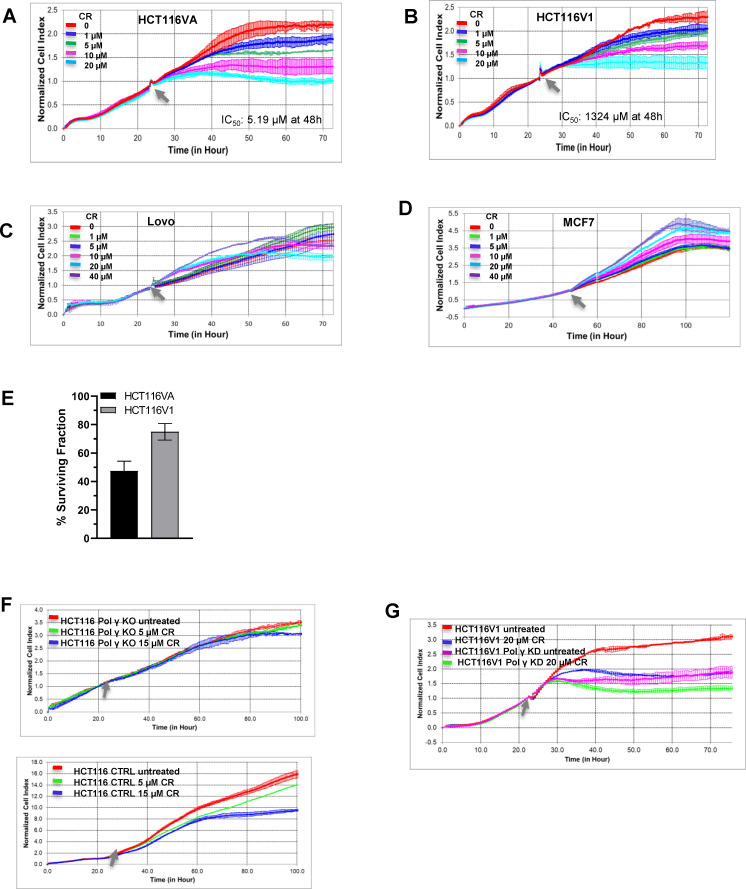
Fig 4. The effects of Pol γ inhibitor molecules on MLH1 deficient and proficient cancer cell proliferation.
Real-time dynamic monitoring of the cytotoxic effects of CR on (A) HCT116VA (MLH1 deficient) (B) HCT116V1 (MLH1 proficient) (C) Lovo (MLH1 proficient) (D) MCF7 (MLH1 proficient) cells using the xCELLigence system. Cell growth was continuously monitored every 30 min. Cell index was normalized to the time point of CR administration. Normalized cell index was plotted as the mean value from triplicates; error bars represent the standard deviation of the mean. The Grey arrow indicates the time of CR administration. The xCELLigence RTCA software was used to determine IC50 values at 48h post-treatment time point. (E) Effect of 5 μM CR (IC50 = 5.19 μM) on colony formation in HCT116VA and HCT116V1 cells. Data are expressed as the mean ± standard deviation of three independent experiments. (F) Upper panel, Real-time dynamic monitoring of the cytotoxic effects of CR on CRISPR/Cas9 Pol γ knockout HCT116 cells and lower panel HCT116 control cells (empty vector control). (G) Real-time dynamic monitoring of the cytotoxic effects of CR on shRNA Pol γ knockdown HCT116V1 cells and HCT116V1 control cells.

