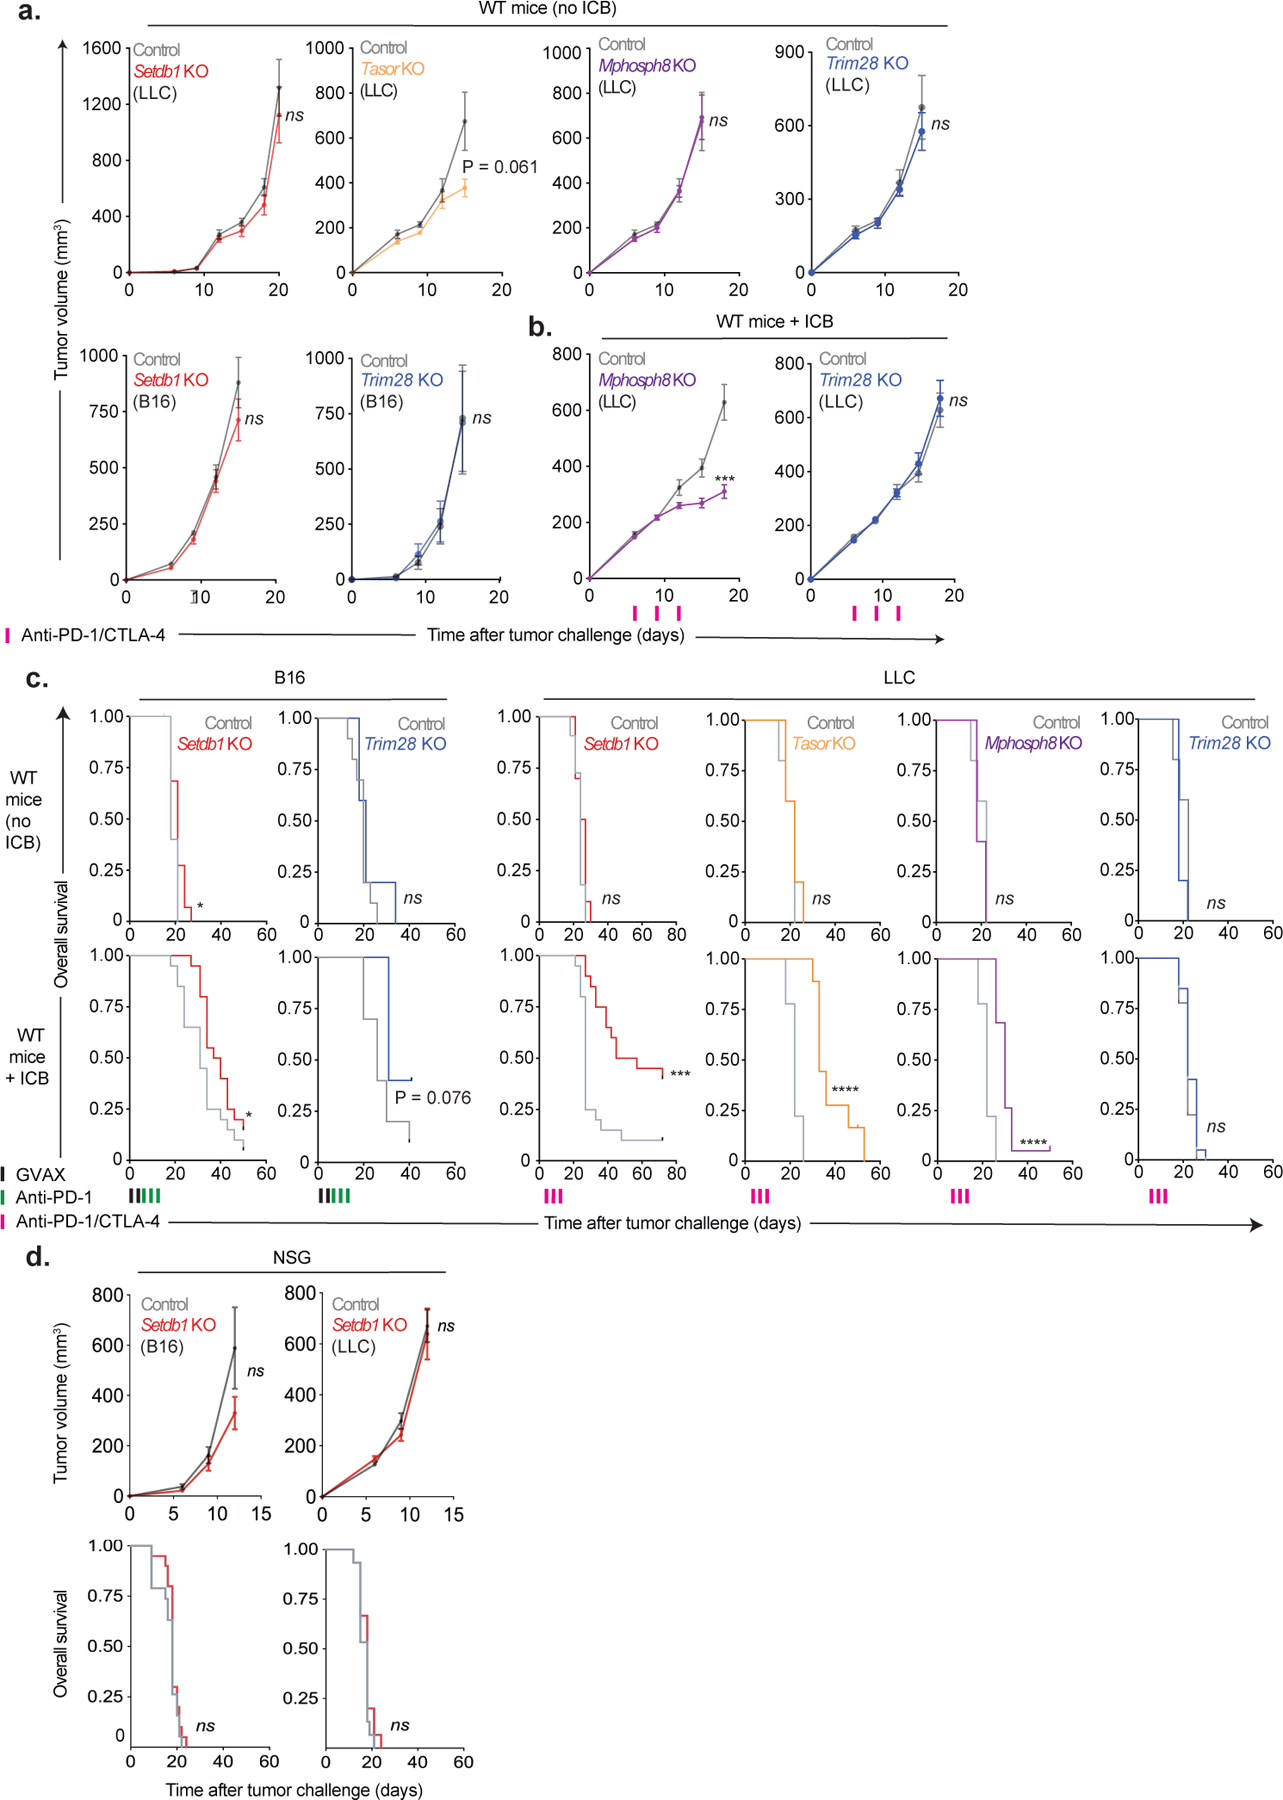
Extended Data Fig. 2. Tumor growth and survival data for Setdb1, Trim28, and HUSH complex KO.

(a) Tumor growth (mean +/− s.e.m.) in untreated WT mice (no ICB) inoculated with Setdb1 (n=10) Tasor (n=5), Mphosph8 (n=5), or Trim28 (n=5) KO LLC cells, or Setdb1 or Trim28 KO B16 cells. Data are representative of 3 (Setdb1), 1 (Tasor), 1 (Mphosph8), 1 (Trim28 in LLC), and 2 (Trim28 in B16) experiments. Statistics by two-sided Student’s t-test at the indicated time-points. (b) Tumor growth (mean +/− s.e.m.) in WT mice treated with ICB inoculated with Mphosph8 (n=20) or Trim28 (n=20) KO LLC cells. Data represent 1 independent experiment. Statistics by two-sided Student’s t-test at the indicated time-points. (c) Overall survival for untreated (top) and ICB-treated (bottom) WT mice inoculated with B16 (left) or LLC (right) tumors and corresponding to Fig. 1d and Extended Data Fig. 2a–b. Statistics by log-rank test. (d) Tumor growth (top, mean +/− s.e.m.) and overall survival (bottom) for untreated NSG mice (no ICB) inoculated with Setdb1 KO B16 (left, n=20) or LLC (right, n=15). Data represent 1 experiment. Statistics for tumor growth by two-sided Student’s t-test at the indicated time-points. Statistics for overall survival by log-rank test. *P < 0.05; ***P < 0.001; ****P < 0.0001.
