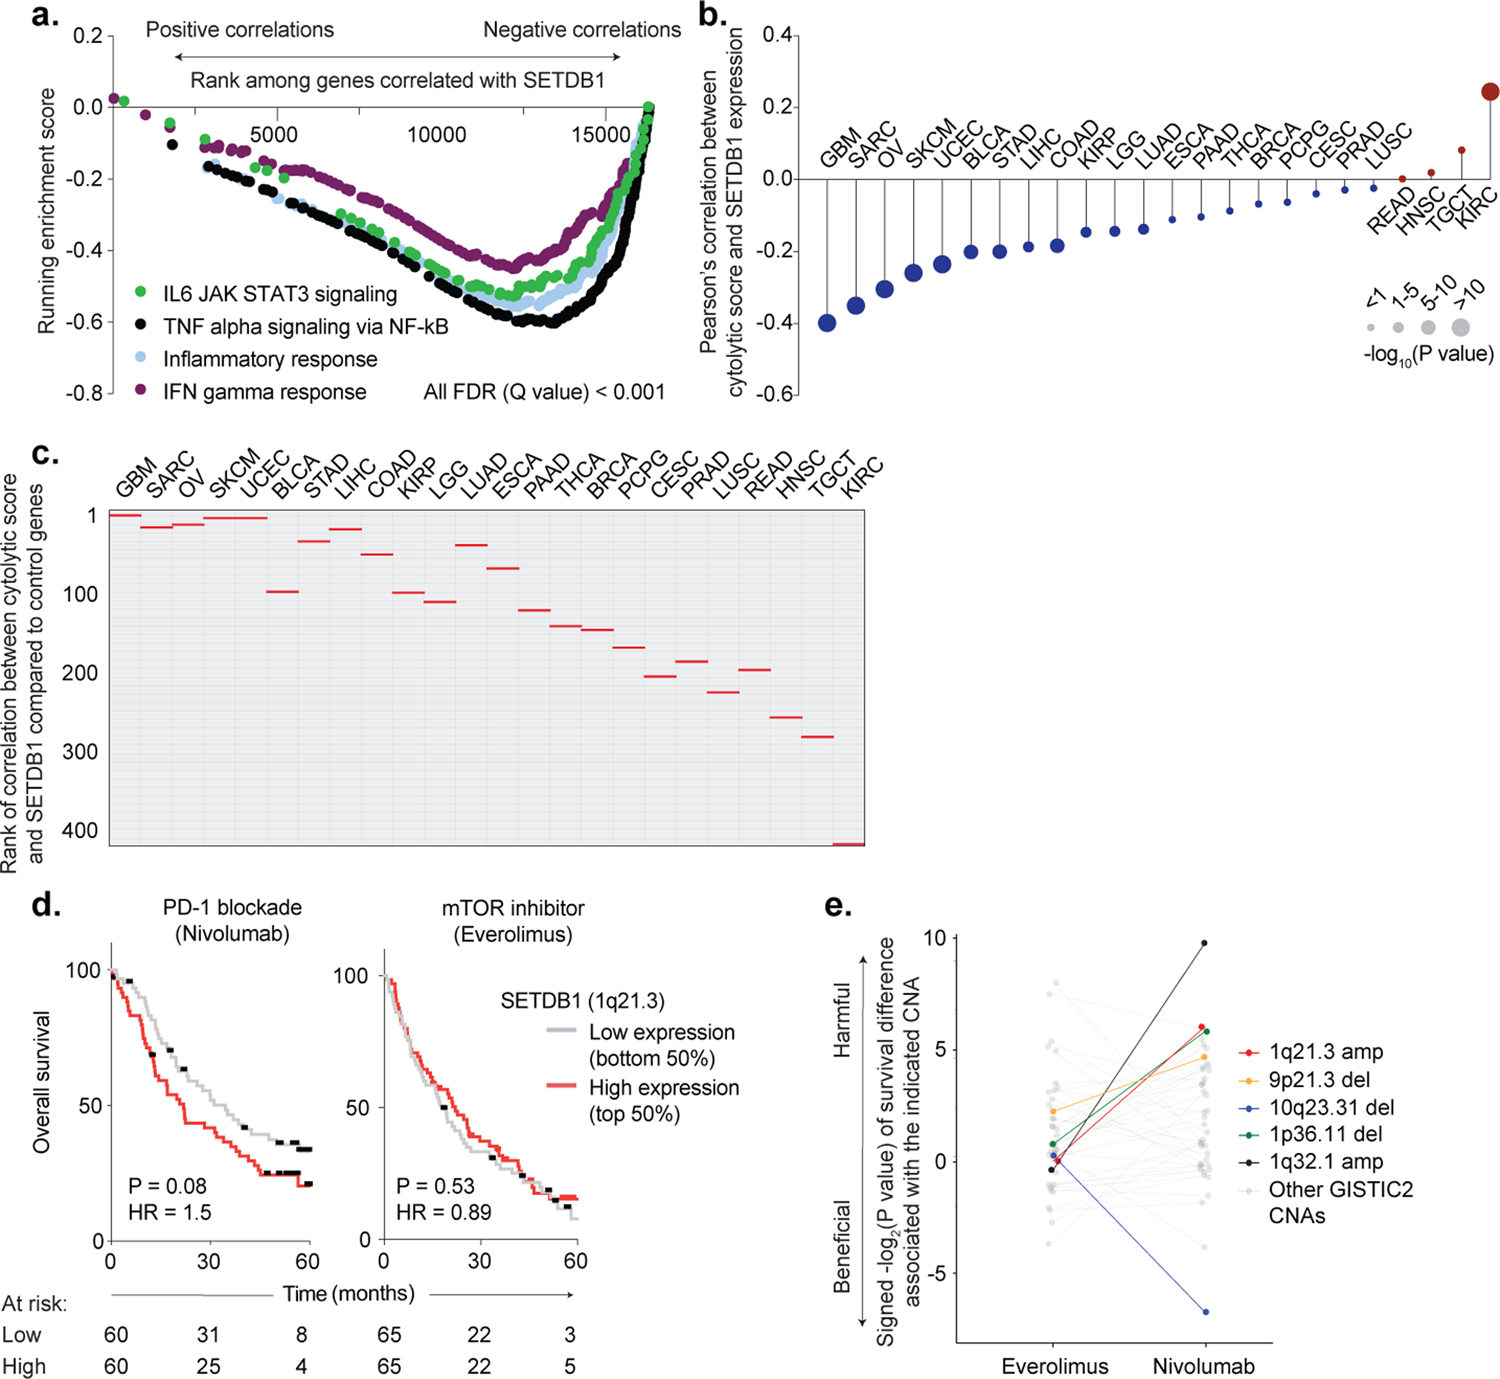
Extended Data Fig. 3. SETDB1 (1q21.3) amplification in human TCGA and ICB-treated cohorts.

(a) Running enrichment scores by GSEA for immune gene sets significantly (FDR <0.001) anti-correlated with SETDB1 expression by Pearson’s correlation across TCGA cohorts. (b) Pearson’s correlation between SETDB1 expression and cytolytic score (geometric mean of PRF1 and GZMA expression) in TCGA cohorts. Circle size indicates statistical significance (−log10(P value)) of the Pearson’s correlation. (c) Bootstrap analysis plotting the rank of the correlation between cytolytic score and SETDB1 expression (red lines) in each TCGA cohort, compared to 408 randomly selected control genes (grey lines). (d) Kaplan-Meier curves for patients with renal cell carcinoma treated with PD-1 blockade (left, nivolumab) or mTOR inhibitor (right, everolimus). Overall survival curves are stratified according to SETDB1 expression (top 50% = high expression, bottom 50% = low expression). Hazard ratios associated with SETDB1 high expression are listed. The number of patients-at-risk are indicated for each timepoint. Statistics by log-rank test. (e) Bootstrap analysis showing the impact of GISTIC2-defined copy-number alterations (CNA) on overall survival in patients treated with mTOR inhibitor (left, everolimus) or PD-1 blockade (right, nivolumab). Positive values indicate a CNA that has a harmful impact on survival with ICB or mTOR inhibitor, and negative values indicate a CNA that has a beneficial effect. 1q21.3 amplification (red) is highlighted alongside chromosomal regions previously reported as predictors of ICB response in RCC, including 10q23.31 deletion (associated with improved response) and 9p21.3 deletion (associated with poor response).
