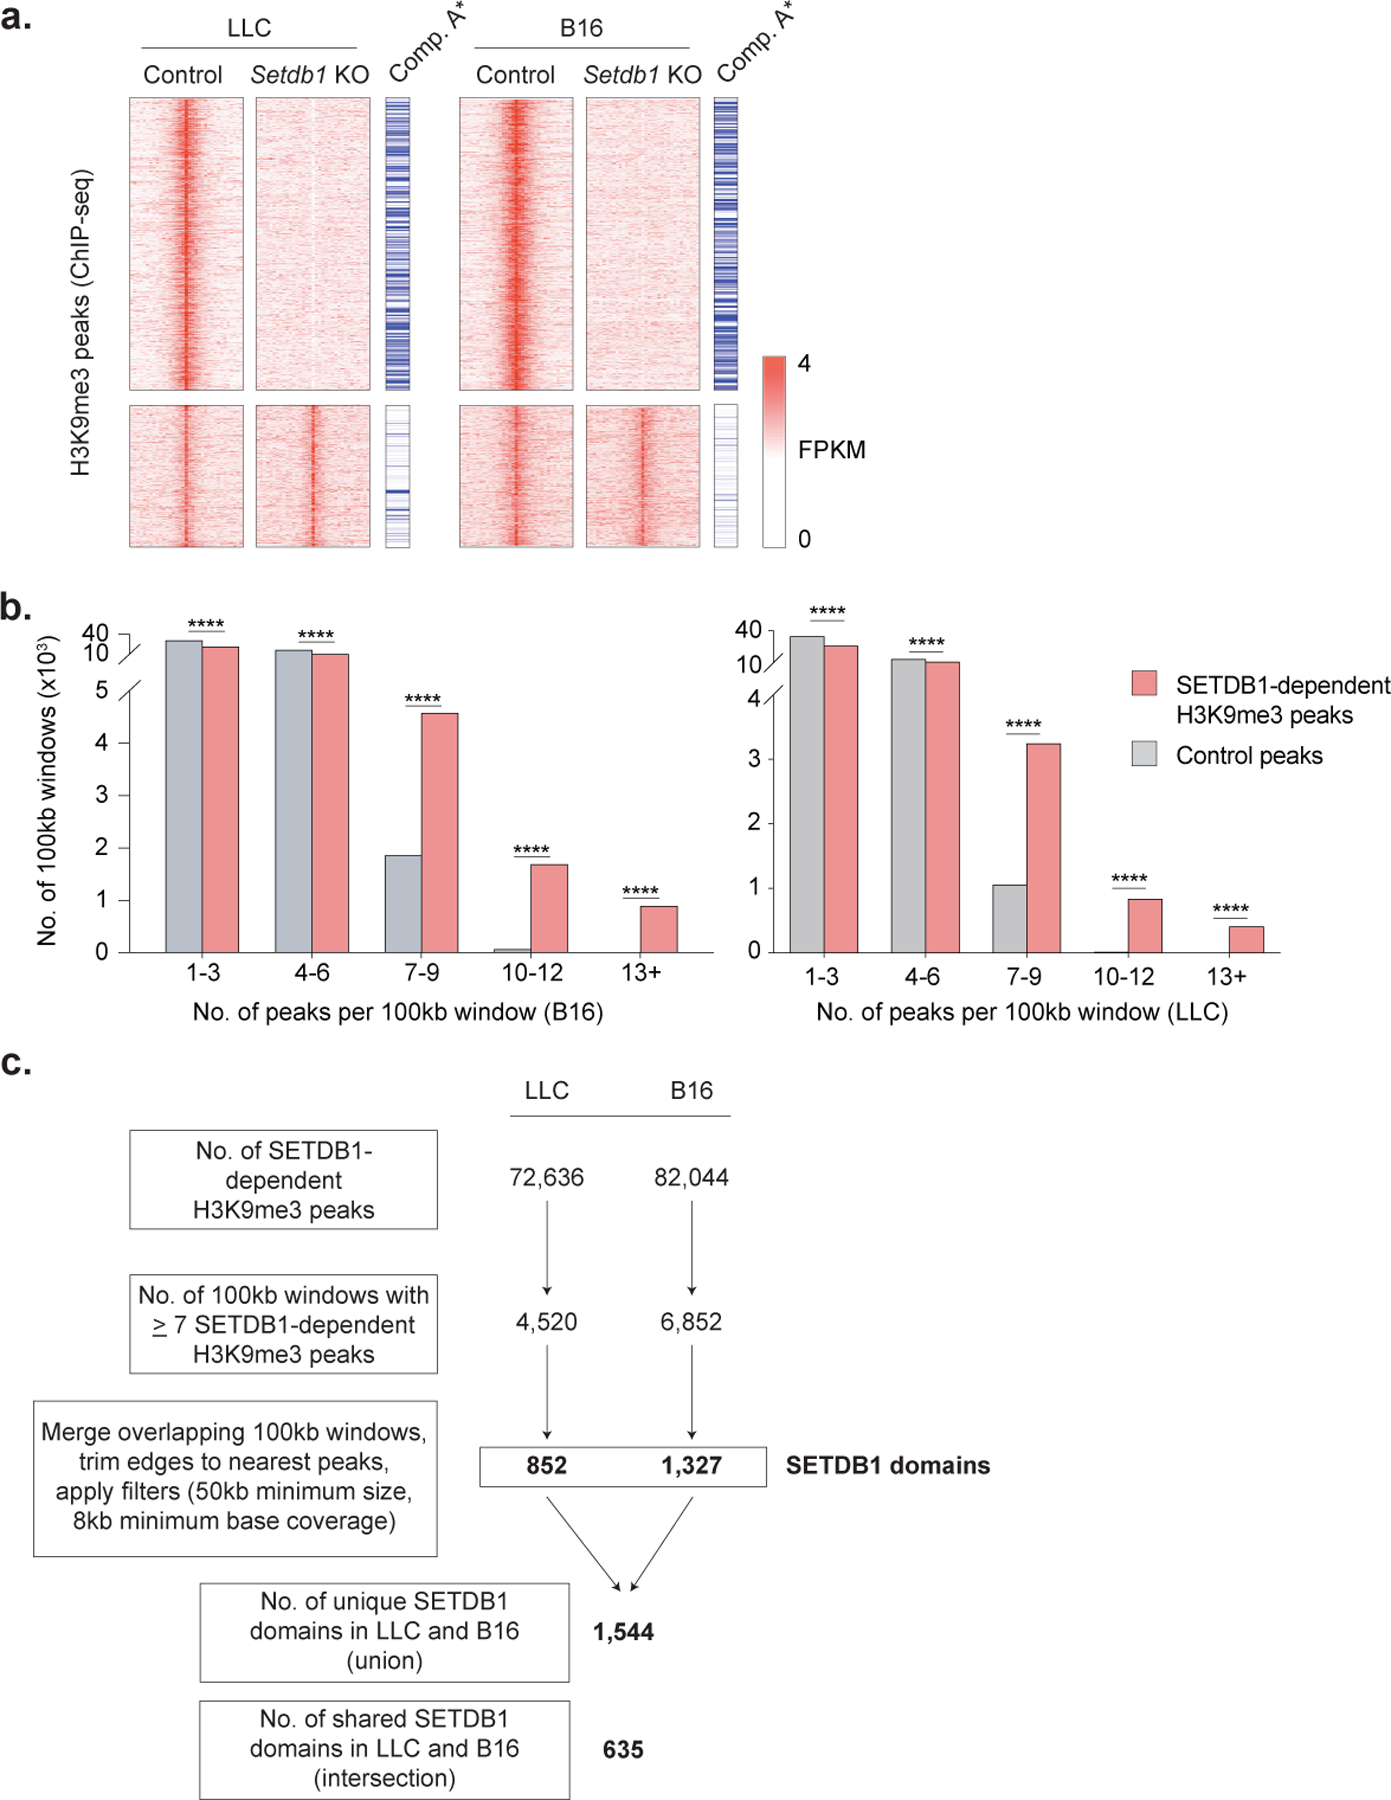
Extended Data Fig. 4. Identification of SETDB1 domains.

(a) Heatmap of H3K9me3 peaks (rows, FPKM) in control and Setdb1 KO LLC (left) and B16 (right) cells. Peaks are separated based on whether they were lost (top) or retained (bottom) in Setdb1 KO cells, and annotated by whether they are located in the open compartment A of the genome. Statistics for compartment A enrichment by permutation testing. (b) The number of 100kb windows containing the indicated numbers of SETDB1-dependent H3K9me3 peaks in B16 (left) or LLC (right) cells, compared to random control peaks. Statistics by Chi-square test. (c) Workflow for annotation of SETDB1-domains from H3K9me3 ChIP-seq data in LLC and B16 cells. *P < 0.05; ****P < 0.0001.
