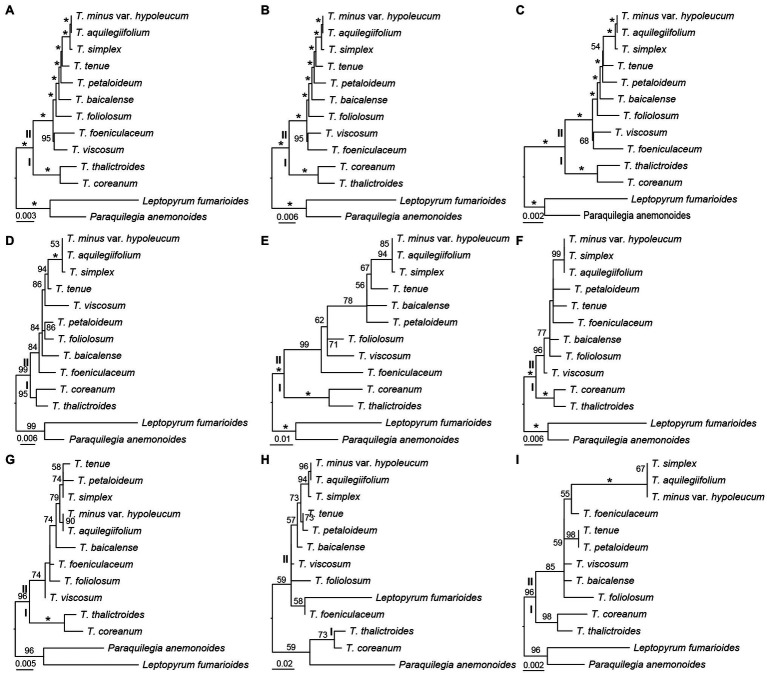
Figure 4.
Phylogenetic relationships of Thalictrum inferred from maximum likelihood (ML) analysis. (A) All sequence, (B) concatenation of 115 IGS regions, (C) concatenation of 114 gene sequences, (D) rpl16 (with intron, Soza et al., 2012), (E) ndhC-trnVUAC (Soza et al., 2013), (F) ndhA intron (Wang et al., 2019), (G) trnLUAA-trnFGAA (Wang et al., 2019), (H) rpl32-trnLUAG (Wang et al., 2019), and (I) rbcL (Wang et al., 2019). The numbers above the branches indicate bootstrap support (%), and the asterisk indicates 100% bootstrap support in ML tree.

