
Figure 2. Dose-Response Association of Physical Activity and Sedentary Time With Risk of Incident Stroke.
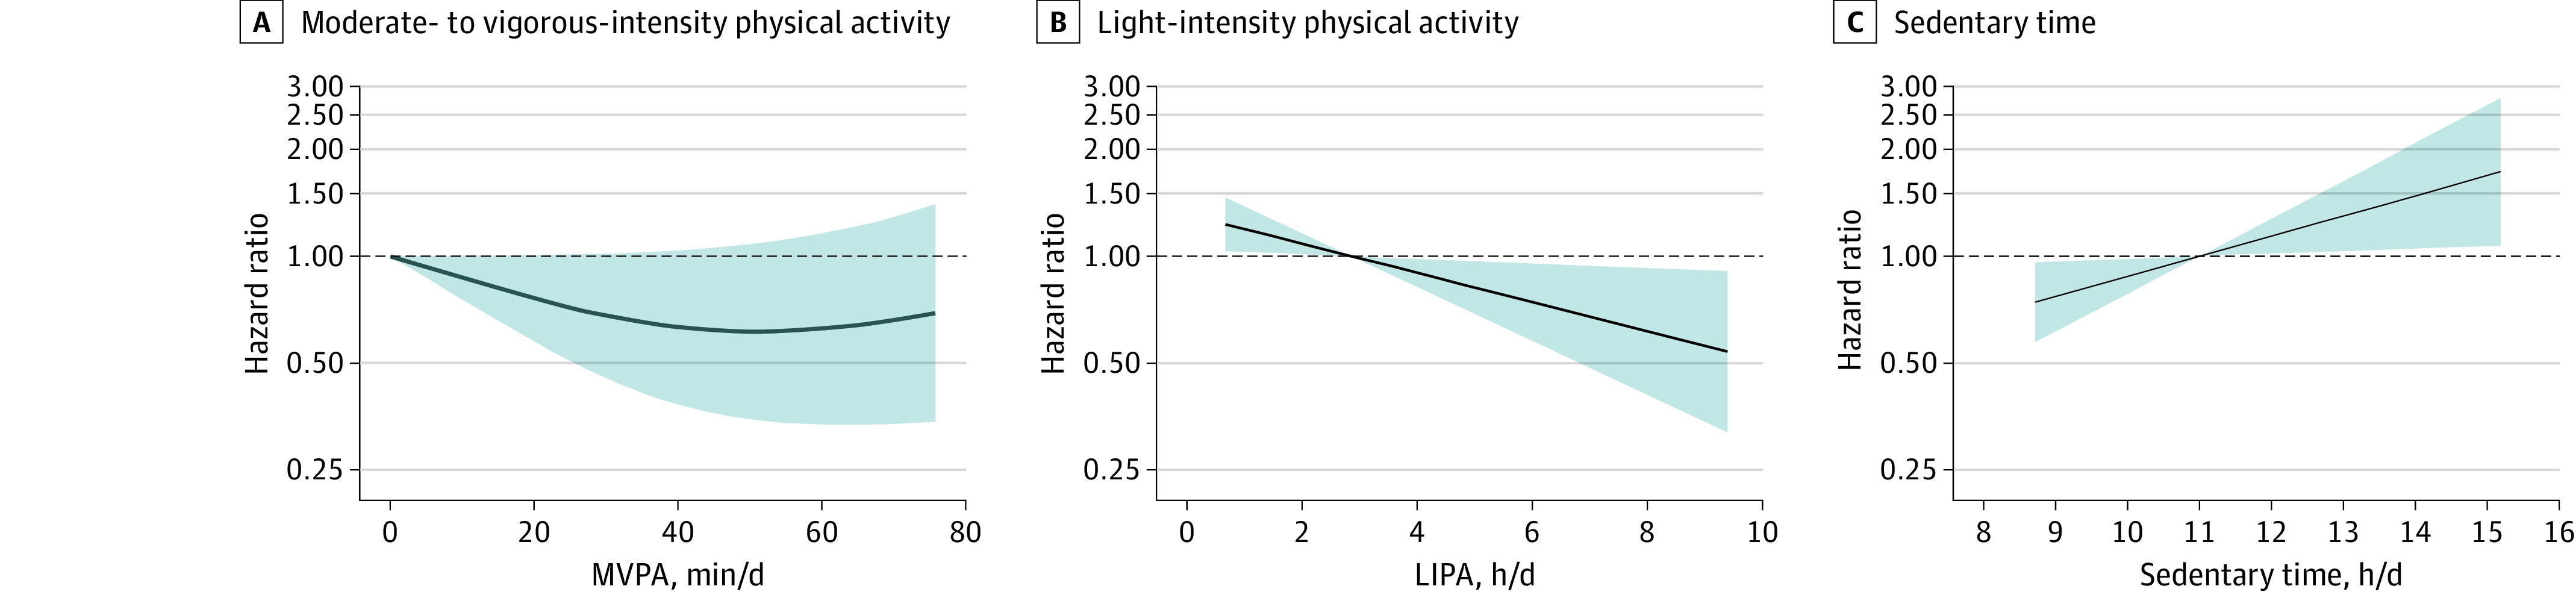
Models were adjusted for age, race, sex, region of residence, educational level, season the accelerometer was worn, current smoking, alcohol use, atrial fibrillation, left ventricular hypertrophy, history of coronary heart disease, and either moderate- to vigorous-intensity physical activity for models testing sedentary time and light-intensity physical activity or sedentary time for models testing moderate- to vigorous-intensity physical activity. The dark blue lines represent hazard ratios, and shaded areas represent 95% CIs. A, Data were fitted using a nonlinear model (P = .15 for nonlinear association). Cubic polynomials were fitted with restrictions placed on the resulting curve to ensure a smooth appearance using 3 knots placed at the 5th, 20th, and 70th percentiles. The referent was the approximate median of the lowest tertile (0 minutes/day). B, Data were fitted using a linear model (P = .01). The referent was the approximate median of the lowest tertile (2.0 hours/day). C, Data were fitted using a linear model (P = .01). The referent was the approximate median of the lowest tertile (11.0 hours/16-hour day).