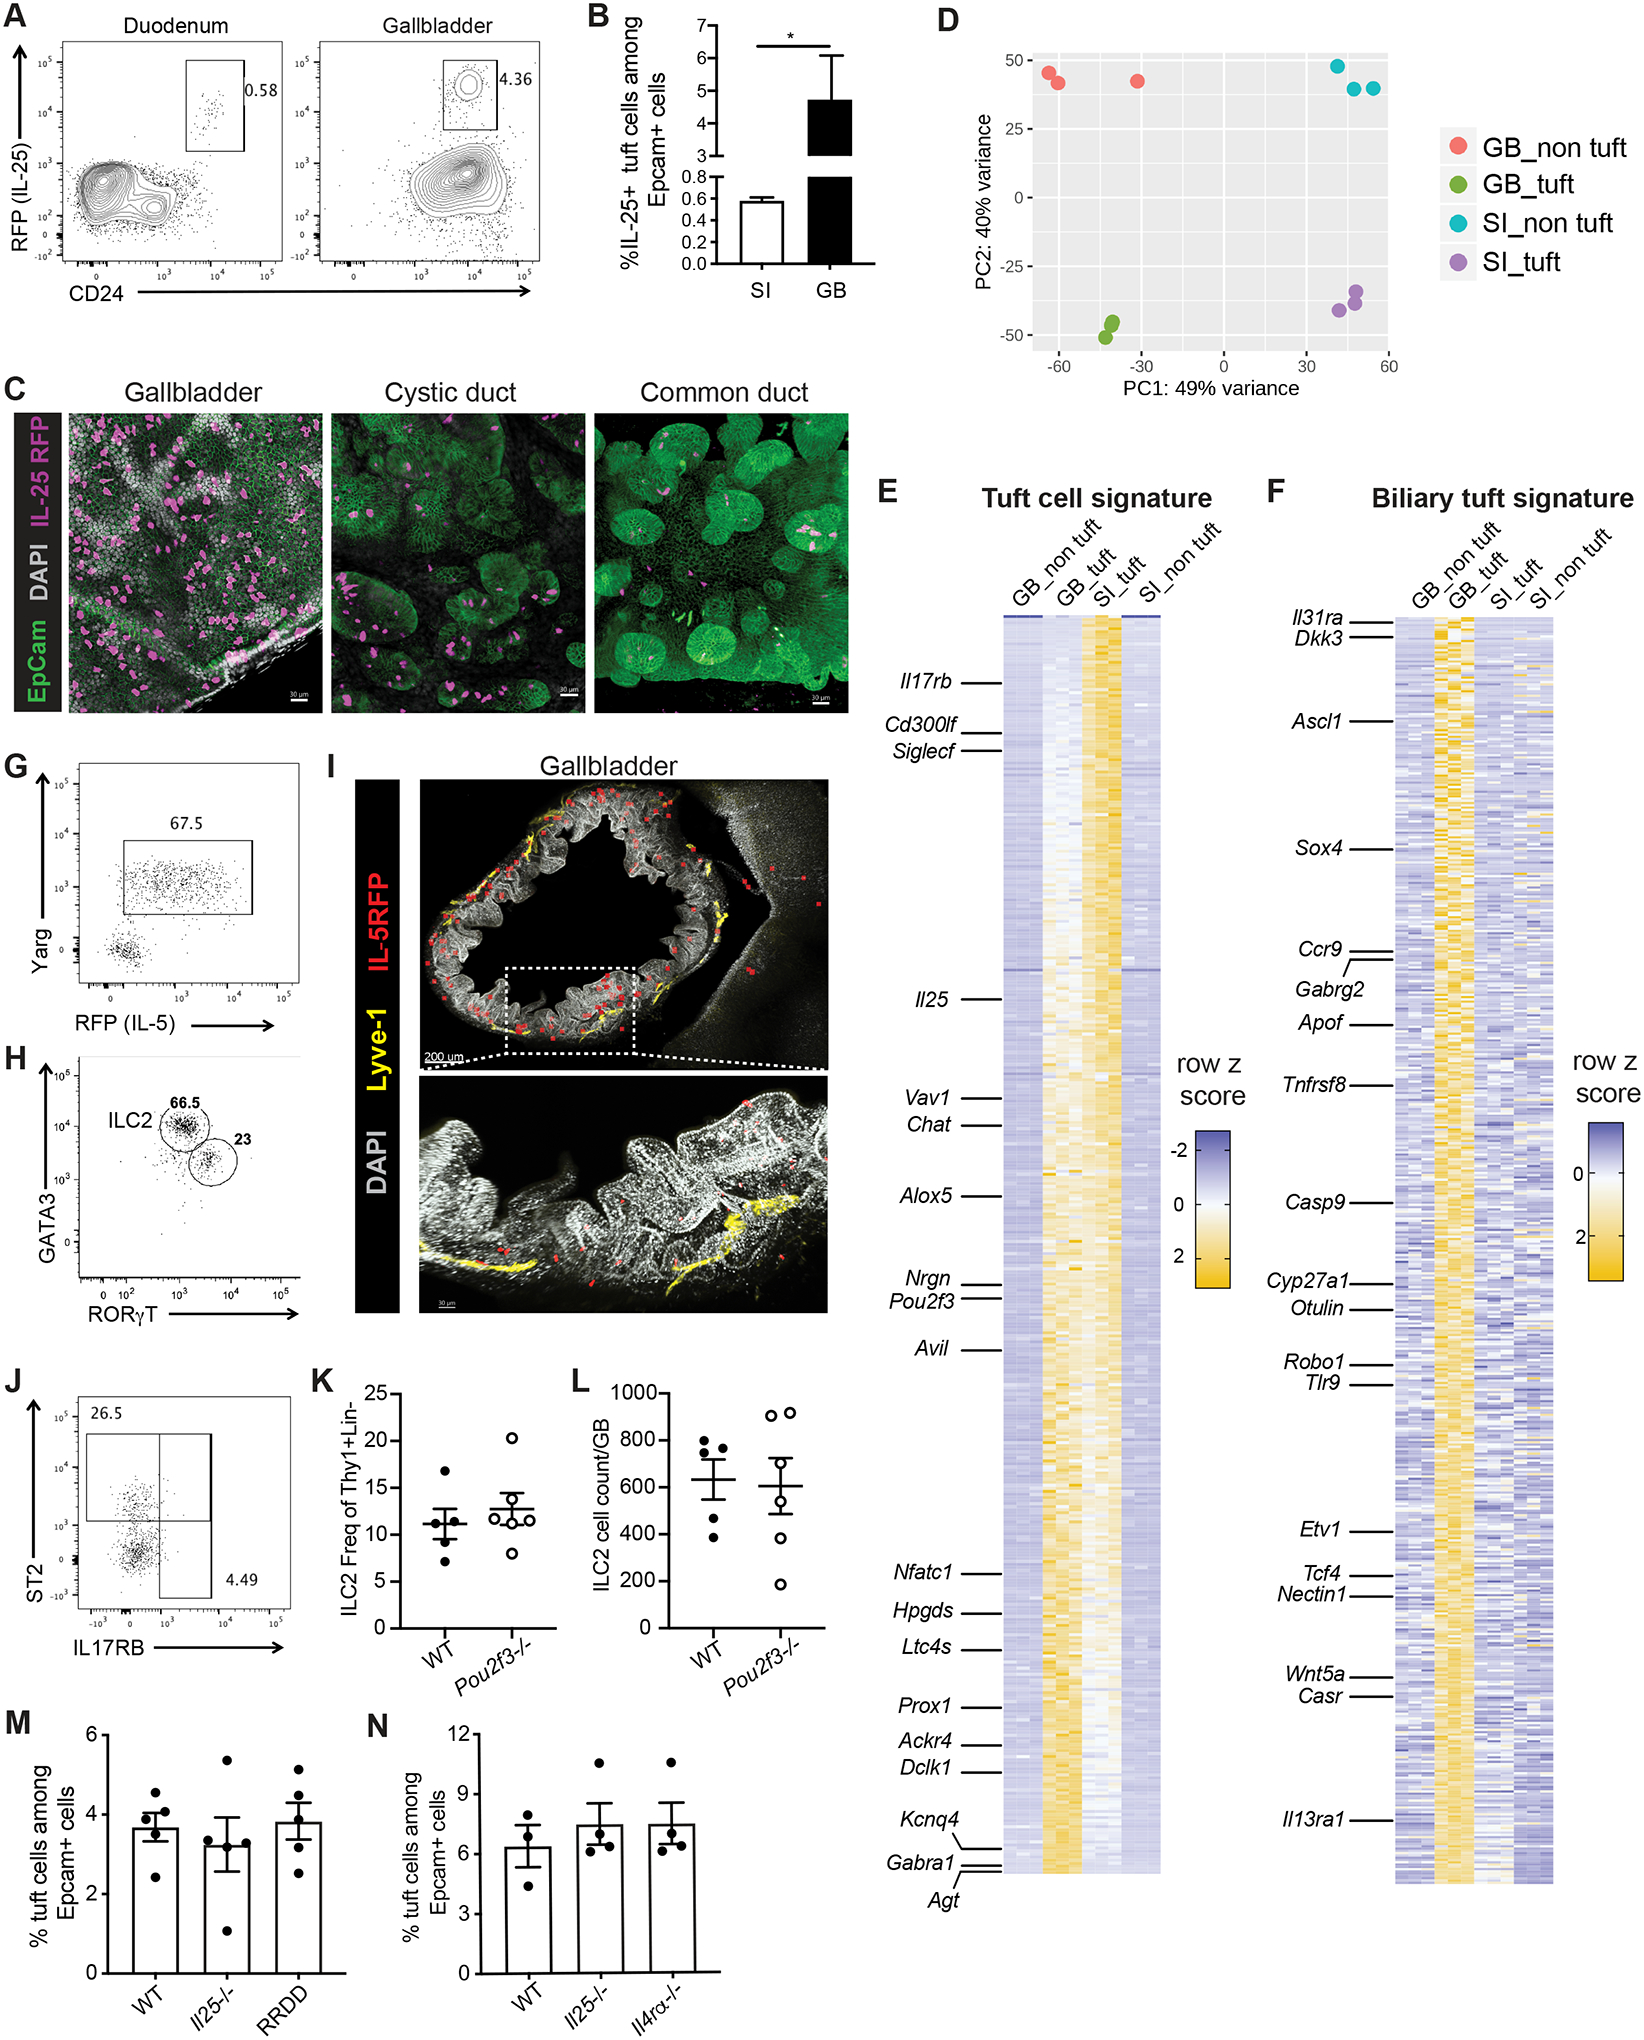
Fig. 1. Biliary tuft cells express tuft cell-specific and tissue-specific gene signature and are not dependent on type 2 cytokines.

A,B) Epithelial cells from duodenum (SI) or gallbladder (GB) of IL-25 reporter (Flare25) mice were examined by flow cytometry. A) Representative flow plot. Previously gated on live singlets, FSC-A × SSC-A, EpCam+CD45-. B) IL-25+ cells as frequency of EpCam+ epithelial cells from SI and GB, 3 mice, *p<.05 by two-tailed paired T test. Representative of >3 experiments. C). Whole mount confocal imaging of Flare25 mouse GB, cystic duct, and common bile duct. D) Tuft and non-tuft epithelial cells were sorted from duodenum or GB of Flare25 mice and analyzed by RNA sequencing. Unsupervised PCA of top 500 genes by variance: biliary tuft (GB_tuft), biliary non-tuft (GB_non tuft), small intestinal tuft (SI_tuft), and small intestinal non-tuft (SI_non tuft). E,F) Row z score for tuft cell-specific transcripts (E) and (F) biliary tuft cell-specific transcripts. G,H) Representative flow plots. ILC2s identified in total GB/EHBD digests from Arginase1 (YARG) and IL-5 (Red5) reporter mice (G) and by transcription factor staining (H). Previously gated on live singlets, FSC-A × SSC-A, CD45+lineage-Thy1+,TCR-NKp46-NK1.1-. I) Imaging of GB and liver from RosaAi14-RFP × Red5 mice, stained for RFP (ILC2s, red), EpCam (green), LYVE-1 (yellow), and DAPI (gray). J) As in (G,H), staining for ST2 and IL17RB on ILC2s in total GB/EHBD digest. Previously gated on live singlets, FSC-A × SSC-A, CD45+lineage-Thy1+,TCR-NKp46-NK1.1-.YARG+. K,L) Relative frequency (K) and count (L) of ILC2s per GB/EHBD from WT and Pou2f3−/− YARG/Red5 reporter mice, as assessed by flow cytometry. M,N) Frequency of tuft cells among biliary epithelial cells from Il25−/−, ILC2 deficient (RRDD), and Il4Rα−/− mice determined by flow cytometry for DCLK1.
