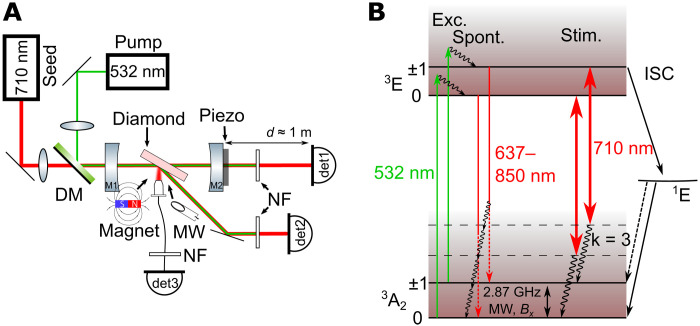
Fig. 1. Concept for measuring stimulated emission.
(A) Experimental setup: The pump laser (532 nm) and the seeding laser (710 nm) are combined with a dichroic mirror (DM) and individually focused into the cavity. The green laser is blocked via 532-nm notch filters (NF). Detected are the transmitted (det1), reflected (det2), and PL signals (det3). (B) NV− center energy level schematic: The system is pumped (Exc.) by a 532-nm laser from the ground (3A2) to the excited state (3E). The spontaneous emission (Spont.) spectrum is in the red to near-infrared regime (637 to 850 nm). The effective magnetic field Bx, as well as a continuous microwave drive at 2.87 GHz, lead to spin-mixing. Phonon levels are indicated by the shaded area. The three-phonon transitions of the spin ms = 0 ± 1 states at λ = 710 nm, where stimulated emission (Stim.) occurs, are indicated with the large double arrow.

