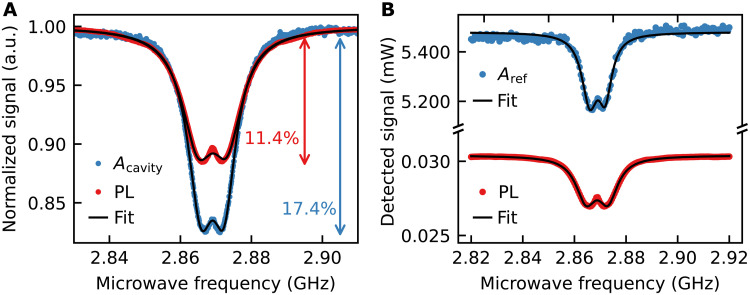
Fig. 5. ODMR via stimulated emission.
(A) Normalized detected power of the transmitted cavity amplitude (Acavity, det1) and PL signal (det3). The arrows show that the cavity mode has better contrast than the simultaneous PL measurement. (B) The detected absolute power of the reflected cavity amplitude (Aref, det2) is much higher than the PL signal, when optimized for high power. A double Lorentzian is fitted to the data for all cases (black lines).

