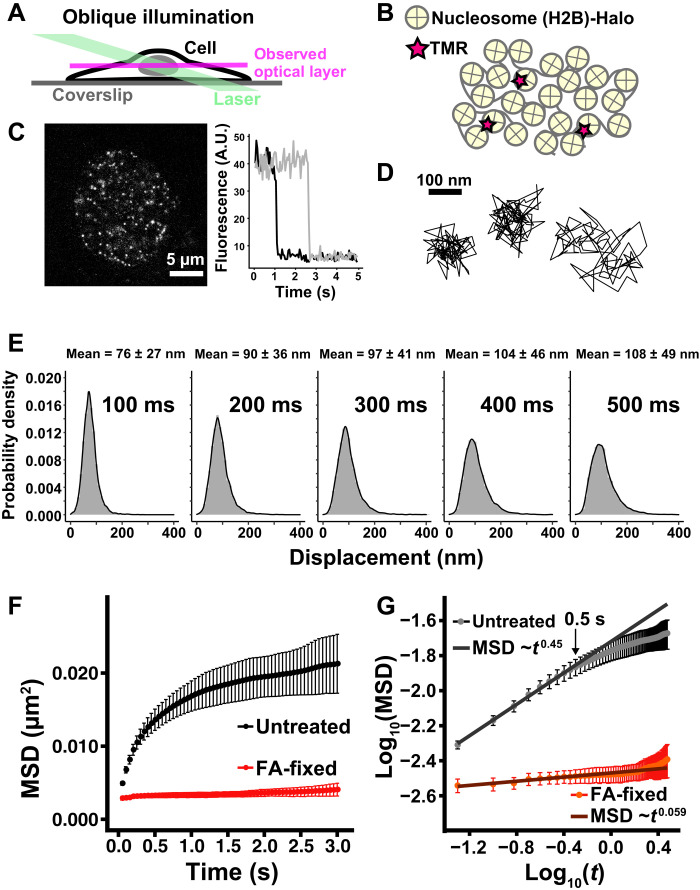
Fig. 1. Single-nucleosome imaging in living HeLa cells.
(A) Oblique illumination microscopy. The illumination laser (green) can excite fluorescent molecules within a limited thin optical layer (magenta) of the nucleus and reduce background noise. (B) A small fraction of H2B-Halo was fluorescently labeled with tetramethylrhodamine (TMR)-HaloTag ligand (red star) and was used to track nucleosome movements at super-resolution. (C) Left: Single-nucleosome (H2B-Halo-TMR) image of a living HeLa nucleus after background subtraction. Right: Single-step photobleaching of two representative nucleosome (H2B-Halo-TMR) dots. The vertical axis represents the fluorescence intensity of individual TMR dots. The horizontal axis is the tracking time series. A.U., arbitrary units. (D) Representative three trajectories of tracked single nucleosomes. (E) Displacement (movement) distributions (n = 15 cells) for 100, 200, 300, 400, and 500 ms. Means ± SD of displacement are indicated at the top. (F) Mean square displacement (MSD) plots (±SD among cells) of single nucleosomes in living untreated control (black) and formaldehyde (FA)–fixed (red) HeLa cells in a tracking time range from 0.05 to 3 s. For each sample, n = 10 to 15 cells. Rc (estimated radius of constraint of the nucleosome motion), 159 ± 15.2 nm (mean ± SD) in living cells; 69 ± 7.5 nm in FA-fixed cells. Their Rc values are significantly different: P = 1.2 × 10⁻⁵ by Kolmogorov-Smirnov test. (G) Log-log plot of the MSD data from (F). The indicated line on the untreated control was fitted using the data from 0.05 to 0.5 s. The plot cannot be fitted linearly beyond this time range, suggesting that the motion mode changes over 0.5 s.

