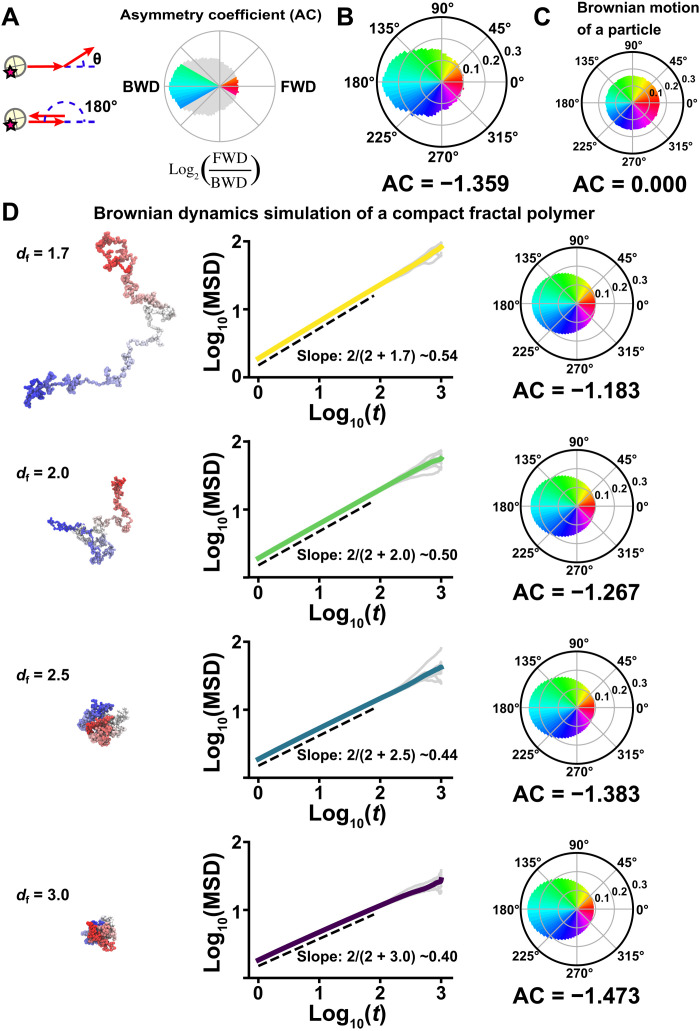
Fig. 2. Nucleosome motion angle distribution and Brownian dynamics simulation.
(A) Nucleosome motion angle-distribution analysis. Left: Schematic for angle-distribution analysis. Right: Schematic for asymmetry coefficient (AC). AC was calculated as the logarithm to the base of 2 of the ratio between the frequencies of forward (FWD) angles (−30° to +30°) and backward (BWD) angles (150° to 210°). AC shows deviation from a homogeneous distribution and is negative for angular distributions where the backward angles are dominant. (B) Measured angle distribution of nucleosomes (105,798 total number of angles). Moving angles of single nucleosomes are biased toward 180° and the AC is negative (for details, see Materials and Methods), indicating that they are pulled back to their original position. (C) Angle distribution of a simulated particle motion driven by thermal fluctuations (1,000,000 angles). The particle motion appears isotropic and the AC is 0.000. (D) Simulation of fractal polymer motion driven by thermal fluctuations (fractal dimension, df = 1.7, 2.0, 2.5, and 3.0). Left: Representative conformations of polymer models. Center: Log-log plots of averaged MSDs (colored) and 10 individual MSDs (gray). The slopes, obeying the theoretical relation 2/(2 + df) (54), are indicated: ~0.54 (df = 1.7), ~0.50 (df = 2.0), ~0.44 (df = 2.5), and ~0.40 (df = 3.0). Right: Corresponding motion angle distributions. The AC is indicated below each angle distribution. Note that a compact polymer (df = 2.5) motion profile closely recapitulated the profile of the measured angle distribution and the AC in (B) and the subdiffusion exponent in Fig. 1G and fig. S2B. Details of the fractal dimension defining the polymer compaction are described in Materials and Methods and (54).

