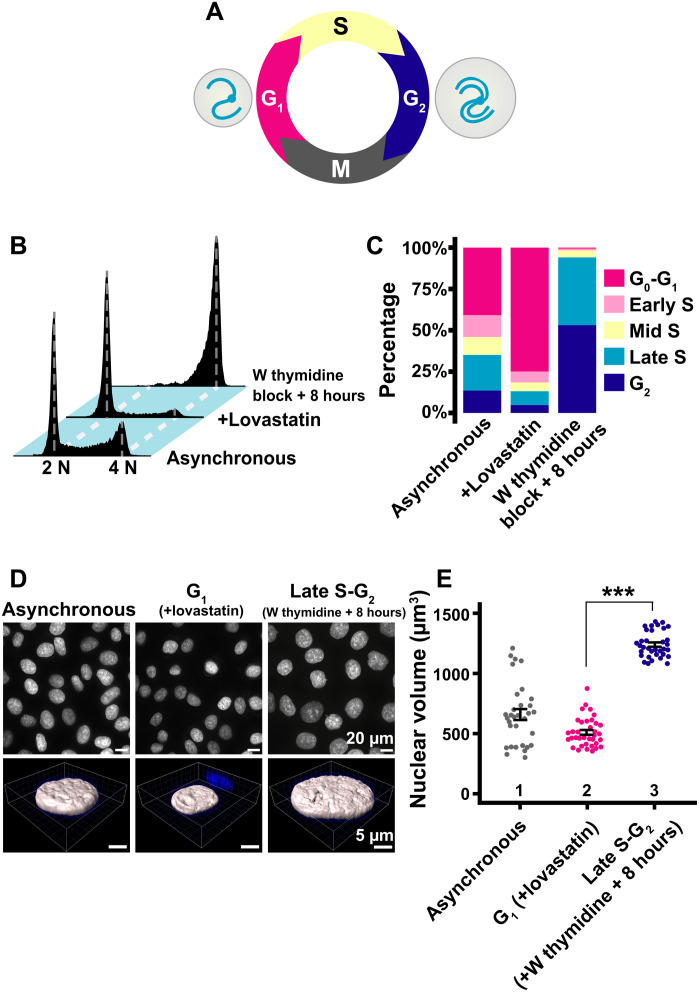
Fig. 3. Synchronization of HeLa cells in G1 and late S-G2 phases and nuclear volume measurements.
(A) Cell cycle progression. The nuclear volume (gray circle) increases as the cell cycle progresses from G1 to G2, with accompanying genomic DNA doubling. (B) Cellular DNA contents in indicated HeLa cell populations measured by flow cytometry. 2 N and 4 N show genomic DNA amount. “W thymidine block” means “double thymidine block.” Each histogram represents more than 16,000 cells. (C) Quantification from data in (B). (D) Top: Low-magnification images of 4′,6-diamidino-2-phenylindole (DAPI)–stained HeLa nuclei with the indicated conditions. Bottom: Reconstructed three-dimensional (3D) images of HeLa nuclei with the indicated conditions. (E) Quantitative data of nuclear volume (means ± SE) of the indicated HeLa cell populations. Mean volumes: lanes 1 (658 μm3, n = 32 cells), 2 (510 μm3, n = 36 cells), and 3 (1263 μm3, n = 37 cells). ***P < 0.0001 (P = 2.3 × 10⁻²¹) by Wilcoxon rank sum test.

