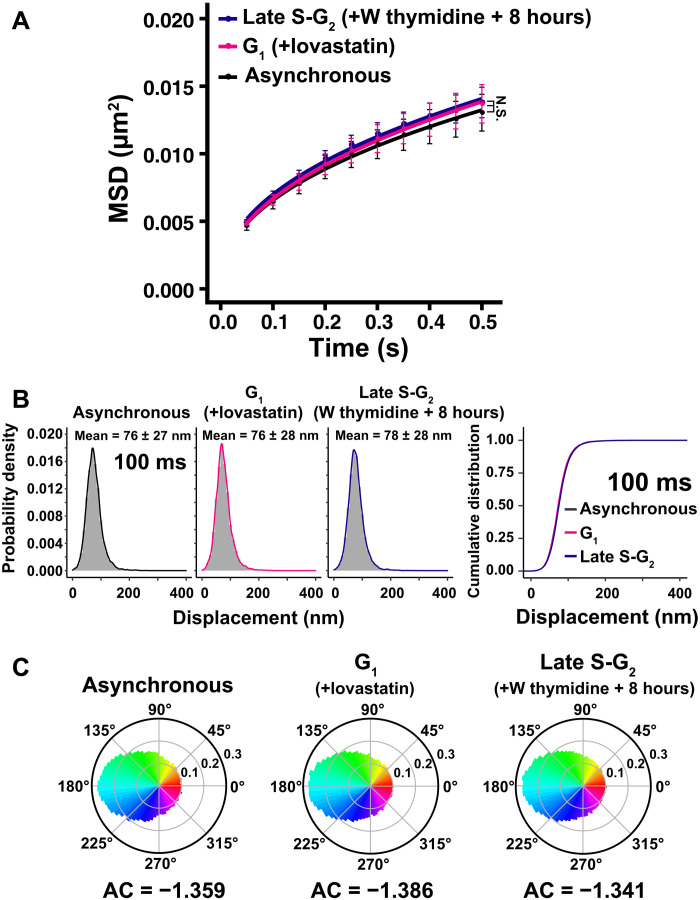
Fig. 4. Local chromatin motion in G1 and late S-G2 phase HeLa cells.
(A) MSD plots (±SD among cells) of nucleosome motion in asynchronous (black), G1 (magenta), and late S-G2 phase (dark blue) HeLa cells from 0.05 to 0.5 s. Nucleosome trajectories used per cell: 617 to 863; n = 15 cells per sample. Not significant (N.S.) by Kolmogorov-Smirnov test for G1 versus late S-G2 (P = 0.93), asynchronous versus G1 (P = 0.18), and asynchronous versus late S-G2 (P = 0.38). “W thymidine block” means “double thymidine block”. (B) Left: Displacement distribution histograms of single nucleosomes (n = 15 cells) for 100 ms of asynchronous, G1 phase (+lovastatin), and late S-G2 phase (W thymidine block +8 hours) cells. Asynchronous data were reproduced from Fig. 1E. Means ± SD of displacement are indicated at the top. Note that the shape of the displacement distribution is similar among asynchronous, G1, and late S-G2 cells. Right: Cumulative distribution plots of the displacement. (C) Angle distribution of asynchronous (105,798 angles), G1 phase (140,607 angles), and late S-G2 phase cells (199,759 angles). The AC is indicated below each angle distribution. Asynchronous data were reproduced from Fig. 2B. Note that the angle-distribution profile and the AC are similar among asynchronous, G1, and late S-G2 cells.

