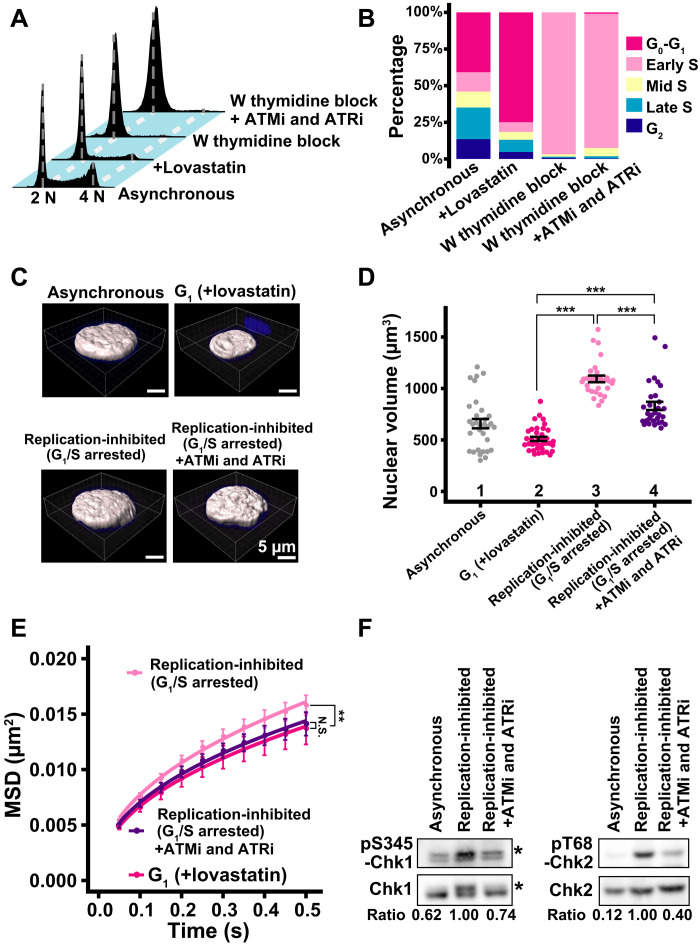
Fig. 5. Effect of chromatin density on local chromatin motion in HeLa cells.
(A) Cellular DNA contents in indicated HeLa cell populations measured by flow cytometry. Each histogram represents more than 16,000 cells. Asynchronous and +lovastatin data were reproduced from Fig. 3B. (B) Quantification from data in (A). (C) Reconstructed 3D images of HeLa nuclei with indicated conditions. Asynchronous and G1 phase nuclei images were reproduced from Fig. 3D. (D) Quantitative data of nuclear volume (means ± SE) of indicated HeLa cell populations. Asynchronous and G1 data were reproduced from Fig. 3E. Mean volumes: lanes 3 (1093 μm3, n = 29 cells) and 4 (831 μm3, n = 30 cells). ***P < 0.0001 by Wilcoxon rank sum test for lanes 2 versus 3 (P = 1.6 × 10⁻¹⁸), 2 versus 4 (P = 2.0 × 10⁻¹²), and 3 versus 4 (P = 3.7 × 10⁻⁷). (E) MSD plots (±SD among cells) of the nucleosome motion in HeLa G1 (magenta), replication-inhibited (pale pink), and replication-inhibited + ATMi and ATRi (purple) cells. G1 data were reproduced from Fig. 4A. Nucleosome trajectories used per cell: 617 to 875; n = 15 cells per sample. **P < 0.001 by Kolmogorov-Smirnov test for G1 versus replication-inhibited (P = 3.5 × 10⁻⁴). N.S. for G1 versus replication-inhibited + ATMi and ATRi (P = 0.68). (F) Inhibition of Chk1 and Chk2 activities by the inhibitor treatment. Western blotting of cell lysates using indicated antibodies. Asterisks denote positions of phosphorylated Chk1. The bottom values indicate the signal intensity ratio of phosphorylated Chk1 or Chk2 versus Chk1 or Chk2, respectively.

