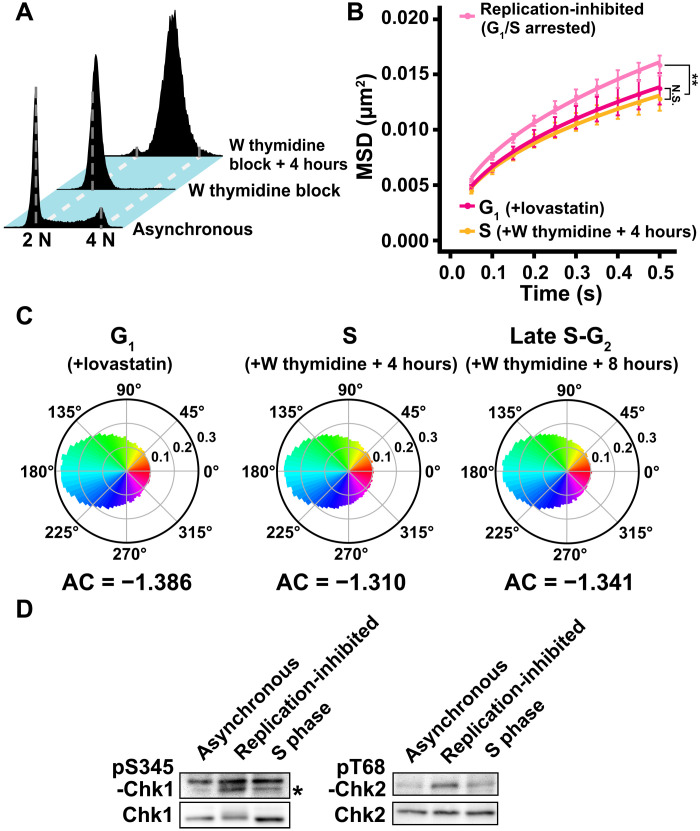
Fig. 6. Local chromatin motion in the S phase.
(A) Cellular DNA contents in indicated HeLa cell populations measured by flow cytometry. Each histogram represents more than 27,000 cells. Asynchronous and W thymidine block data were reproduced from Figs. 3B and 5A. (B) MSD plots (±SD among cells) of the nucleosome motion in HeLa G1 (magenta), replication-inhibited (G1/S arrested) (pale pink), and S phase (W thymidine block + 4 hours) (orange) cells from 0.05 to 0.5 s. G1 and replication-inhibited data were reproduced from Figs. 4A and 5E. Nucleosome trajectories used per cell: 628 to 925; n = 15 cells per sample. **P < 0.001 by Kolmogorov-Smirnov test for G1 versus replication-inhibited (P = 3.5 × 10⁻⁴) and S versus replication-inhibited (P = 3.9 × 10⁻⁷). N.S. for G1 versus S (P = 0.08). (C) Angle distribution of G1 phase (140,607 angles), late S-G2 phase (199,759 angles), and S phase cells (148,019 angles). The AC is indicated below each angle distribution. G1 and late S-G2 data were reproduced from Fig. 4C. Note that the angle-distribution profile and the AC are similar among G1, S, and late S-G2 cells. (D) DDR attenuation after release from W thymidine block. Left: Western blotting of cell lysates using anti-phospho–Chk1 (pS345-Chk1) (marked with asterisk, first row) and anti-Chk1 (second row) antibodies. Note that the upper bands are nonspecific. Right: Western blotting of cell lysates using anti-phospho–Chk2 (pT68-Chk2) (first row) and anti-Chk2 (second row) antibodies. The phosphorylated signals in S phase cells decreased to a similar level of asynchronous cells. Blots were cropped near the protein positions for clarity and space considerations.

