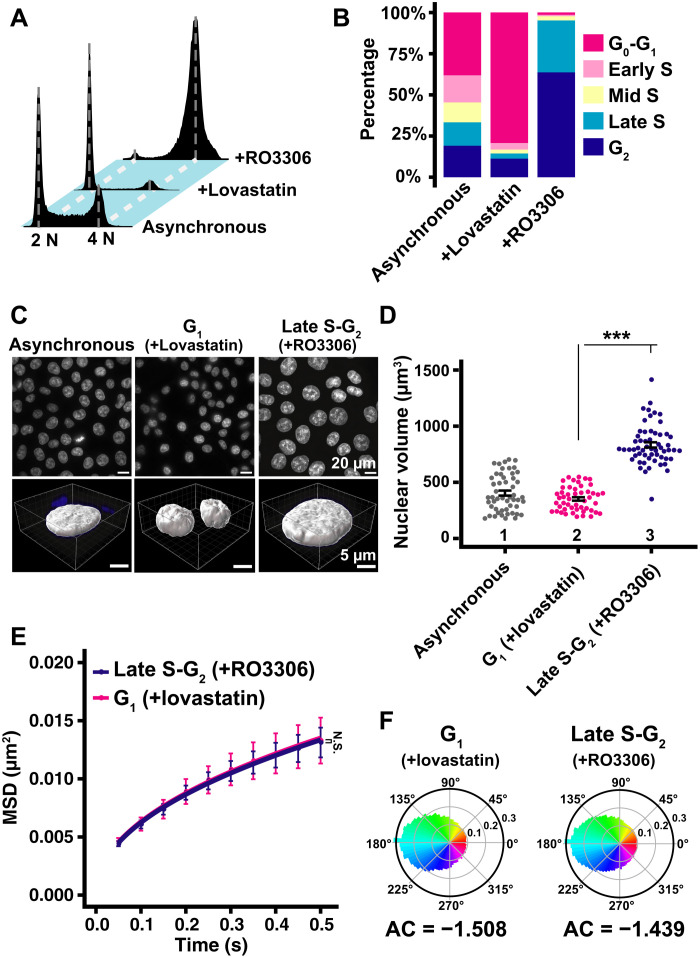
Fig. 7. Local chromatin motion in G1 and late S-G2 phase HCT116 cells.
(A) Cellular DNA contents in indicated HCT116 cell populations measured by flow cytometry. Each histogram represents more than 24,000 cells. (B) Quantification from (A) data. (C) Top: Low-magnification images of DAPI-stained HCT116 nuclei with indicated conditions. Bottom: Reconstructed 3D images of HCT116 nuclei with indicated conditions. (D) Quantitative data of nuclear volume (means ± SE) of indicated HCT116 cell populations. Mean volumes: lanes 1 (404 μm3, n = 52 cells), 2 (352 μm3, n = 49 cells), and 3 (833 μm3, n = 57 cells). ***P < 0.0001 (P = 3.7 × 10⁻¹⁸) by Wilcoxon rank sum test. Note that nuclear volumes in late S-G2–synchronized cells appear much larger than those of G1 cells in the asynchronous population, presumably because prolonged RO3306 treatment might enhance nuclear enlargement. (E) MSD plots (±SD among cells) of nucleosome motion in G1 phase (magenta) and late S-G2 phase (dark blue) HCT116 cells from 0.05 to 0.5 s. Nucleosome trajectories used per cell: 801 to 2110; n = 10 cells per sample. N.S. (P = 0.93) by Kolmogorov-Smirnov test. (F) Angle distribution of G1 phase (81,610 angles) and late S-G2 phase (289,328 angles). The AC is indicated below each angle distribution. Note that the angle-distribution profile and the AC is similar between G1 and late S-G2 cells.

