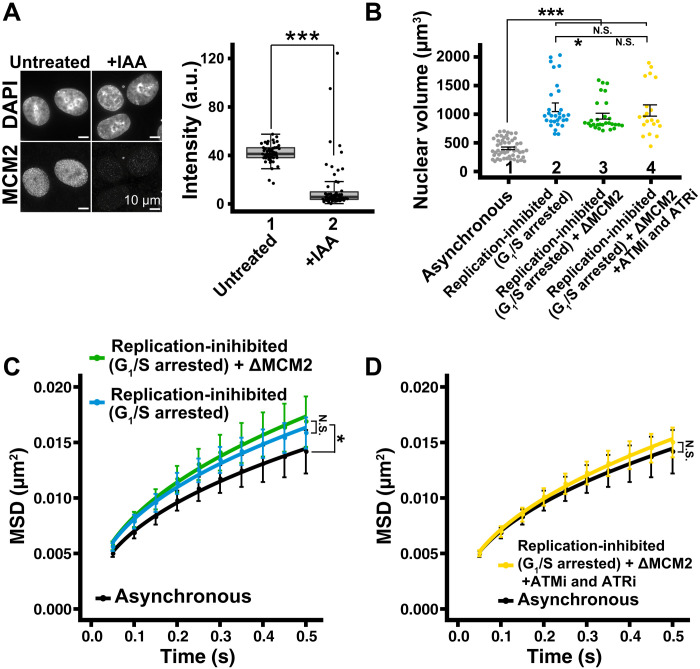
Fig. 8. Effect of chromatin density on local chromatin motion in HCT116 cells.
(A) Left: Immunostaining of MCM2 depletion. Right: Box plots of MCM2 signal intensity. Median values: lanes 1 (41.8, n = 49 cells) and 2 (13.9, n = 55 cells). ***P < 0.0001 (P = 2.7× 10⁻¹³) by Wilcoxon rank sum test. (B) Quantitative data of nuclear volume (means ± SE) of indicated HCT116 cell populations. Asynchronous data were reproduced from Fig. 7D. Mean volumes: lanes 2 (1121 μm3, n = 30 cells), 3 (965 μm3, n = 29 cells), and 4 (1064 μm3, n = 20 cells). ***P < 0.0001 by Wilcoxon rank sum test for lanes 1 versus 2 (P = 1.3 × 10⁻¹³), 1 versus 3 (P = 1.1 × 10⁻¹³), and 1 versus 4 (P = 1.9 × 10⁻⁹). *P < 0.05 for lanes 2 versus 3 (P = 0.032). N.S. for lanes 2 versus 4 (P = 0.38) and lanes 3 versus 4 (P = 0.33). (C) MSD plots (±SD among cells) of nucleosome motion in HCT116 asynchronous (black), replication-inhibited (light blue), and replication-inhibited + ΔMCM2 (green). Nucleosome trajectories used per cell: 1500 to 2590; n = 13 to 15 cells per sample. *P < 0.05 by Kolmogorov-Smirnov test for asynchronous versus replication-inhibited (P = 0.0037) and asynchronous versus replication-inhibited + ΔMCM2 (P = 0.013). N.S. for replication-inhibited versus replication-inhibited + ΔMCM2 (P = 0.16). (D) MSD plots (±SD among cells) of single nucleosomes in asynchronous (black) and replication-inhibited + ΔMCM2 + ATMi and ATRi (yellow). Asynchronous data were reproduced from (C). Nucleosome trajectories used per cell: 1500 to 2590; n = 13 to 15 cells per sample. N.S. by Kolmogorov-Smirnov test for asynchronous versus replication-inhibited + ΔMCM2 + ATMi and ATRi (P = 0.21).

