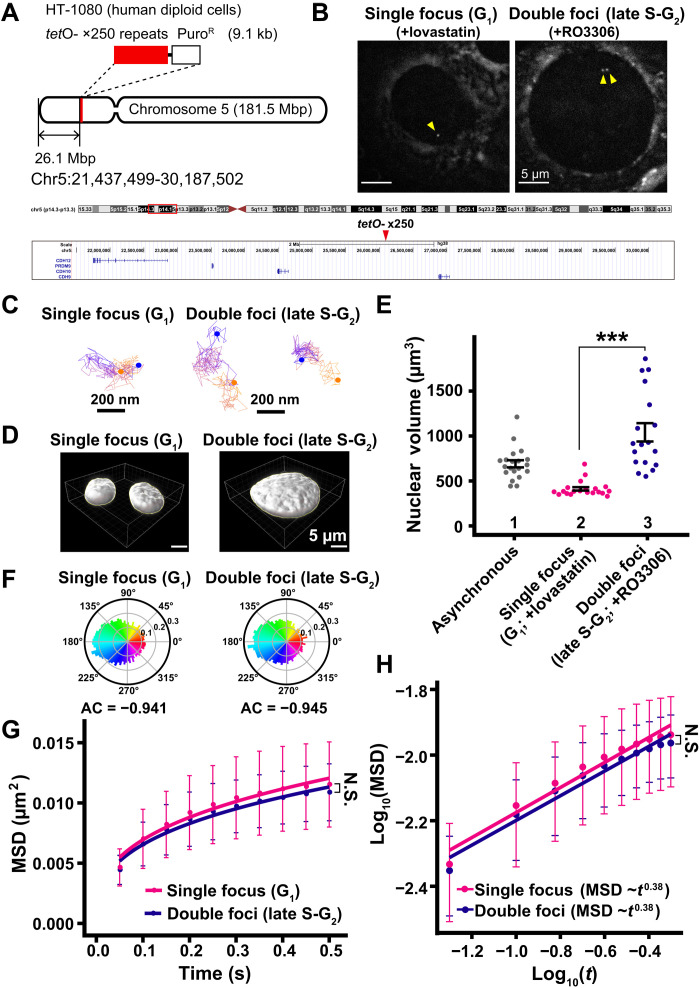
Fig. 9. Motion of specific genomic loci in G1 and late S-G2 phase.
(A) Schematic depicting the location of tetO repeats (×250) in a gene-poor region of human chromosome 5. (B) TetR-4xmCh foci images of living HT-1080 cells after background subtraction. The cells were synchronized in G1 (left, +lovastatin) and late S-G2 (right, +RO3306) phases. Foci are indicated by yellow arrowheads. (C) Representative trajectories of tracked single focus and double foci. Starting points and end points are shown in orange or blue dots, respectively. (D) Reconstructed 3D images of HT-1080 nuclei with indicated conditions. (E) Quantitative data of nuclear volume (means ± SE) of indicated HT-1080 cell populations. Nuclear volume increased 2.53-fold from G1 to late S-G2 phase. Mean volumes: lanes 1 (691 μm3, n = 20 cells), 2 (412 μm3; n = 20 cells), and 3 (1041 μm3, n = 18 cells). ***P < 0.0001 (P = 1.1 × 10⁻⁹) by Wilcoxon rank sum test. (F) Angle distribution of single focus (G1; +lovastatin; 12,315 angles) and double foci (late S-G2; +RO3306; 14,685 angles). The AC is indicated below each angle distribution. Note that the angle-distribution profile and the AC are similar between G1 and G2 cells. (G) MSD plots (±SD among cells) of TetR-4xmCh foci motion in G1 phase (magenta) and late S-G2 phase (dark blue) HT-1080 cells from 0.05 to 0.5 s. For each sample, n = 21 cells. N.S. (P = 0.36) by Kolmogorov-Smirnov test. (H) Log-log plot of the MSD data from (G). The plots were fitted linearly: MSD = 0.016 t0.38 in G1 cells; MSD = 0.015 t0.38 in late S-G2 cells.

