Figure 1.
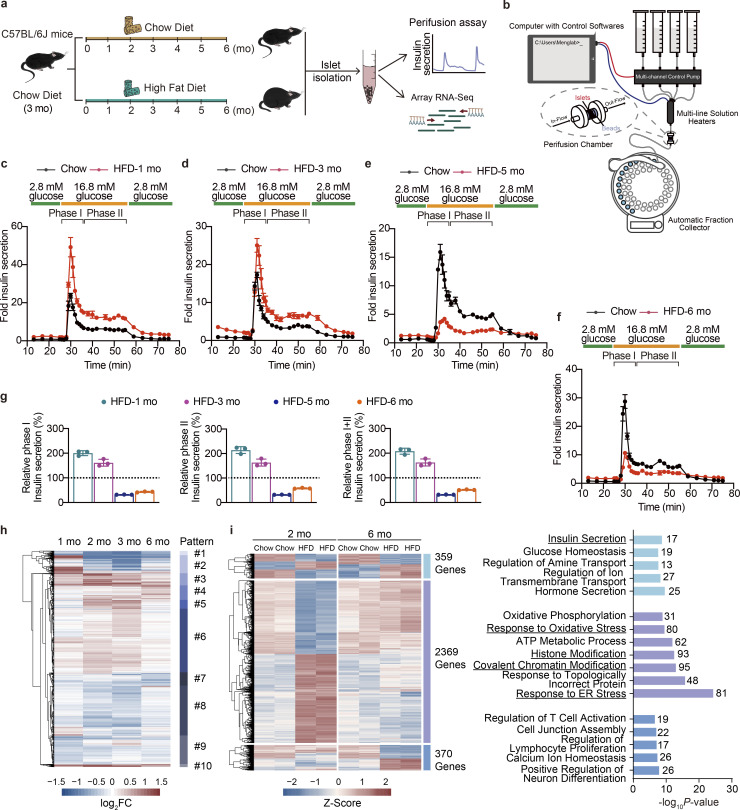
Dynamic functional and transcriptional profiles of pancreatic islet adaptation in response to continuous HFD feeding. (a) Schematic representation of the experimental setup. (b) Schematic of the islet perifusion system. (c–f) Perifusion analyses of dynamic glucose-stimulated phase I and phage II insulin secretion in islets from mice fed with HFD for 1, 3, 5, and 6 mo and their corresponding controls. Each islet sample was pooled from at least three animals. Data represent mean ± SD; n = 3 technical replicates. (g) Relative phase I and phase II and total (I + II) insulin secretion in islets from mice fed with HFD for 1, 3, 5, and 6 mo shown in c–f determined by calculating the AUC of each HFD group against their respective control group set as 100% (shown in black dashed lines). Each islet sample was pooled from at least three animals. Data represent mean ± SD; n = 3 technical replicates. (h) Unsupervised clustering of differentially expressed genes in timescale HFD feeding. log2FC values against their respective chow diet–fed control group in each time point are shown (scale bar, −1.5 to 1.5). Dendrogram was manually cut to obtain 10 clusters representing 10 change patterns. (i) Differential expression analysis of genes with significant changes in primary islets isolated from mice underwent either 2 or 6 mo of HFD feeding. Heatmap showing scaled fragments per kilobase of exon model per million mapped fragments (as Z-Score) of genes with significant changes in both time points (in light blue), exclusively in the 2 mo (in purple), and exclusively in the 6 mo (in sky blue; left, scale bar indicats −2 to 2), and GO enrichment analysis of biological processes featuring these patterns (right), most significant and nonredundant biological processes with respective gene numbers and P values are shown. Data in c–g are representative of at least two independent experiments.

