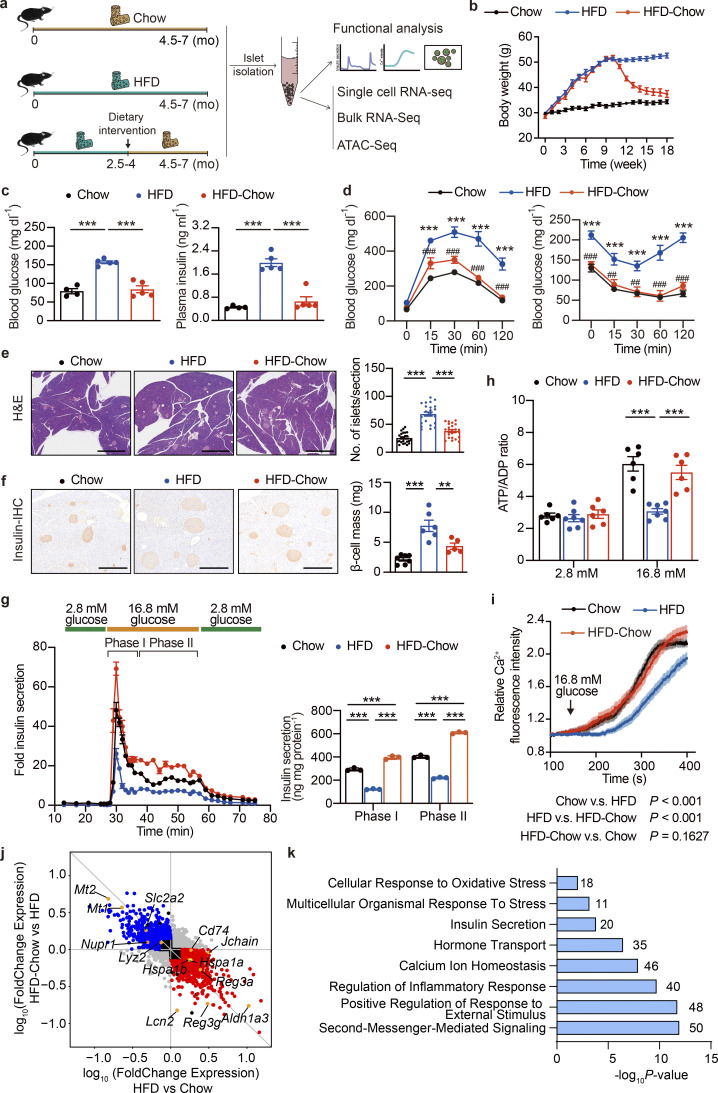
Figure 2.
Dietary intervention prevents HFD-induced β cell dysfunction and systemic metabolic defects. (a) Schematic representation of the experimental setup. (b) Body weight changes in mice with indicated treatments. Data represents mean ± SEM (n = 7–9 mice per group). (c) Overnight fasting blood glucose levels (left) and plasma insulin levels (right) of Chow, HFD, and HFD-Chow mice. Data represent mean ± SEM (n = 4–5 mice per group); ***, P < 0.001; one-way ANOVA. (d) GTT (left) and ITT (right) of Chow, HFD, and HFD-Chow mice. Data represent mean ± SEM (n = 5 mice per group), ***, P < 0.001, HFD vs. Chow; ##, P < 0.01, ###, P < 0.001, HFD-Chow vs. HFD; two-way ANOVA with multiple comparisons. (e) Representative H&E staining of pancreas sections from Chow, HFD, and HFD-Chow mice (left panel), and islet number per pancreas section (right). Scale bar, 1 mm. Data represent mean ± SEM (n = 24 pancreas sections from six mice/group; at least 4 sections/mouse).***, P < 0.001; one-way ANOVA. (f) Representative IHC images of mouse pancreas sections from Chow, HFD, and HFD-Chow mice immune-stained for insulin (brown) and counterstained with hematoxylin (blue; left). Quantitation of β cell mass in the pancreas of Chow, HFD, and HFD-Chow mice (right). Scale bar, 500 μm. Data represent mean ± SEM (n = 5–7 mice per group). **, P < 0.01; ***, P < 0.001; one-way ANOVA. (g) Perifusion analyses of dynamic glucose-stimulated insulin secretion in islets from Chow, HFD, and HFD-Chow mice (left) and biphasic insulin release levels (right). Each islet sample was pooled from at least three animals. Data represent mean ± SD (n = 3 technical replicates). ***, P < 0.001; one-way ANOVA. (h) ATP/ADP ratios of islets from Chow, HFD, and HFD-Chow mice under low-glucose (2.8 mM) or high-glucose (16.8 mM) treatments, islet samples were pooled from at least three animals. Data represent mean ± SEM (n = 6–7 replicates of islet samples, each sample represent 20 IEQ islets); ***, P < 0.001; one-way ANOVA. (i) Glucose (16.8 mM) stimulated Ca2+ influx in single islet β cells in mice from Chow (n = 128 cells), HFD (n = 178 cells), and HFD-Chow (n = 214 cells) groups. Each islet sample was pooled from at least three animals. Data represent mean ± SEM; two-way ANOVA. (j) Differential gene expression analysis of RNA-Seq of mouse islets from Chow, HFD, and HFD-Chow groups (RNA isolation from islets pooled from three mice). Log10 transferred fold change expression levels of all highly expressed genes (fragments per kilobase of exon model per million mapped fragments >1) in indicated comparisons are shown in the scatter plot. Reversible Genes with |log2FC| > 0.5, P < 0.05 were additionally marked in red (upregulated) and blue (downregulated). (k) GO analysis of Reversible Genes in i. Most significant and nonredundant biological processes with respective gene numbers and P values are shown. All panels report data verified in at least two independent experiments.

