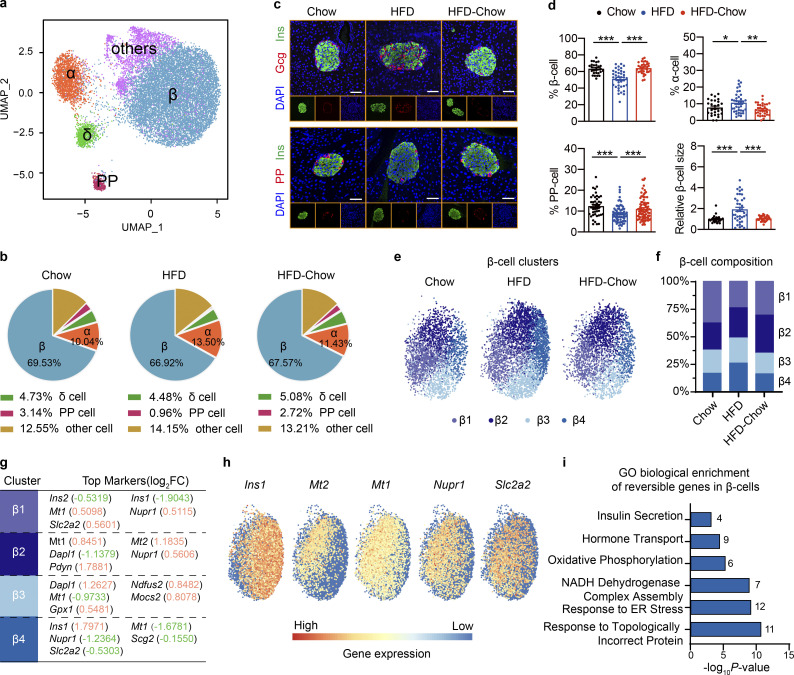
Figure 3.
scRNA-Seq analysis of dietary intervention on islet cell composition and β cell specific transcriptome. (a) scRNA-Seq and UMAP visualization of transcriptome similarity-based cell clustering of islet single cells from indicated groups. Islet sample for each treatment was pooled from at least three animals. In total, 4,231 (Chow), 6,454 (HFD), and 4,490 (HFD-Chow) cells were used in the clustering. (b) Cell composition of islets from indicated groups by scRNA-Seq. (c) Representative immunofluorescent images of insulin (Ins), glucagon (Gcg), and PP in islets from Chow, HFD, and HFD-Chow mice. Scale bar, 50 μm. (d) Quantification of β, α, and PP cell percentage and relative β cell size (n = 27–38 islets per group for % β, % α, and relative β cell size; n = 44–82 islets per group for % PP; islets were pooled from 4 to 5 mice; at least 6 islets per mice) in pancreas sections of Chow, HFD, and HFD-Chow mice. Data represent mean ± SEM; *, P < 0.05; **, P < 0.01; ***, P < 0.001; one-way ANOVA. Relative β cell size was normalized to the average β cell size in Chow group. (e) UMAP visualization of β cell sub-clusters in indicated groups; cells apart from the major β cell cluster on the UMAP plot were not shown. (f) Composition analysis of β cell sub-clusters in indicated groups. (g) Top markers of indicated β cell clusters. Upregulated genes were marked in red, downregulated genes were marked in green. Log2FC indicates the average log2 transferred fold change of indicated gene expression in given subcluster comparing to the expression level in other β cells. (h) Expression heatmap of indicated genes in all β cells. (i) GO analysis of reversible genes (with P < 0.05 by Wilcoxon Rank Sum test) in β cells. Most significant and nonredundant biological processes with respective gene numbers and P values are shown. Data in c and d are representative of at least two independent experiments.

