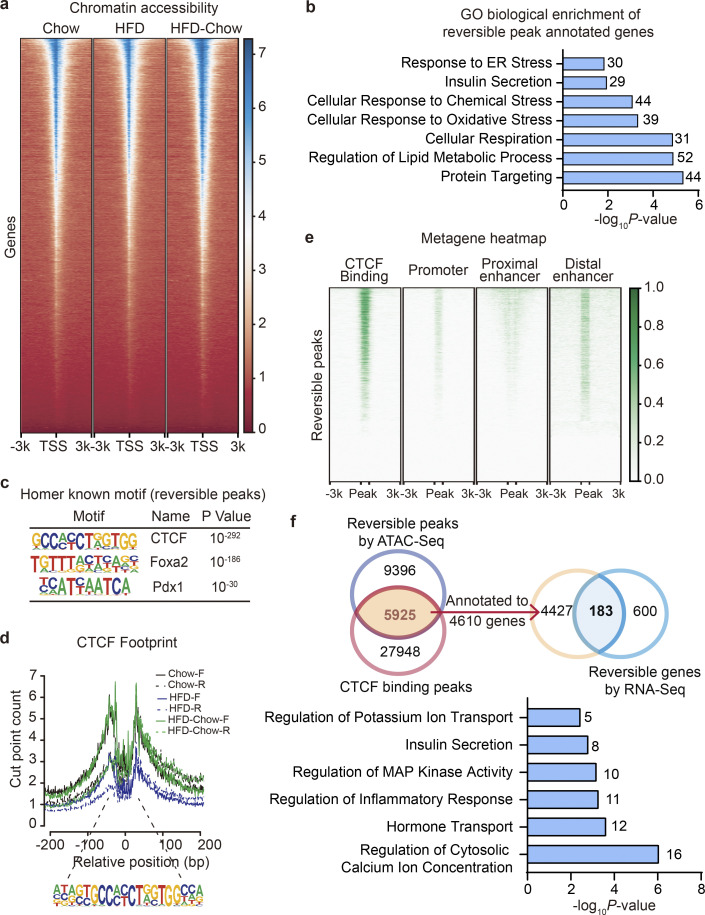
Figure 4.
Identification of CTCF as the top candidate mediating the preservation of β cell function by dietary intervention. (a) Metagene heatmap of the genome-wide ATAC peaks’ occupation in the −3 to +3 kb region flanking the TSS. Scale bar indicates peak density. In each treatment, ATAC-Seq libraries were prepared using islets pooled from three mice. (b) GO analysis of genes annotated to the Reversible Peaks (within −5,000 to +100 bp relative to TSS). Most significant and nonredundant biological processes with respective gene number and P value are shown. (c) Known motif analysis within Reversible Peaks. Consensus islet related motifs (Motif), transcriptional factor names (Name), and P values are shown. (d) Footprint aggregate plots at putative CTCF binding sites. (e) Metagene heatmap of CTCF CUT&Tag peaks and ENCODE annotated CREs around the Reversible Peaks. Scale bar indicates peak density. (f) Upper panel: Venn plot showing the overlap between given datasets and schematic representation of data integration pipeline. Lower panel: GO analysis of light blue shaded genes in the Venn plot. Most significant and nonredundant biological process with respective gene number and P value are shown.

