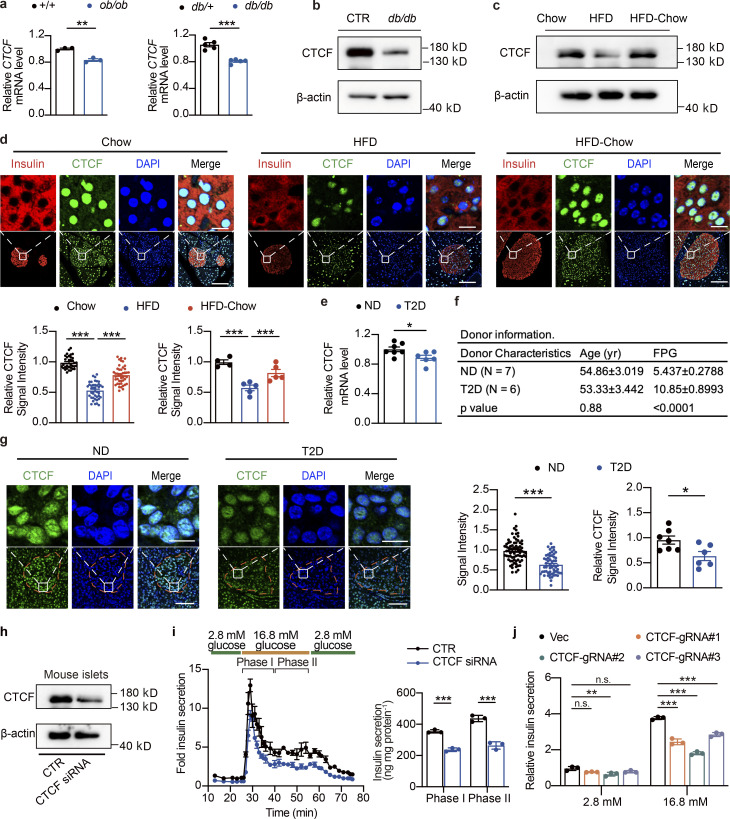
Figure 5.
CTCF expression is downregulated in islets from obese and diabetic mice and humans. (a) Relative CTCF mRNA expression in islets from 12-wk-old ob/ob mice (n = 3 mice per group; data represent mean ± SEM) or 9-wk-old BKS-db/db mice (n = 5 mice per group; data represent mean ± SEM). The relative gene expression levels of CTCF were calculated using the expression values of CTCF in the RNA-Seq (ob/ob mice) or microarray datasets (BKS-db/db, GEO accession no. GSE31559), normalized to their respective controls. **, P < 0.01; ***, P < 0.001; two-tailed unpaired Student’s t test. (b) Representative immunoblots of total islet protein lysates from control (CTR) and 20-wk-old BKS-db/db mice (pooled islet sample from three mice). (c) Representative immunoblots of total islet protein lysates from Chow, HFD, and HFD-Chow mice (pooled islet sample from three mice). (d) Representative immunofluorescent images (up) and relative signal intensities of CTCF (down) in pancreas sections of indicated mouse groups. Data represent mean ± SEM (dots in left panel represent 34–43 islets from 4 to 5 mice; at least 6 islets/mice; dots in right panel represent 4–5 mice); ***, P < 0.001; one-way ANOVA. CTCF signal intensities were normalized to average signal intensity in Chow group. Scale bar, 10 μm (for zoomed-in view), 50 μm. (e) Relative CTCF mRNA expression in human islets from ND and T2D donors obtained from previously published microarray datasets. Data represent mean ± SEM (n = 6–7 donors per group); *, P < 0.05; two-tailed unpaired Student’s t test. (f) Donor information of ND and T2D donors. (g) Representative immunofluorescent images (left) and relative signal intensity of CTCF (right) in human pancreas sections obtained from ND and T2D donors in f. Data represent mean ± SEM (dots in left panel represent 57–75 islets from 6 to 7 donors; at least 6 islets per donor; dots in right panel represent 6–7 donors); *, P < 0.05; ***, P < 0.001; two-tailed unpaired Student’s t test. CTCF signal intensities were normalized to average signal intensity in control group. Scale bars, 10 μm (for zoomed-in view), 50 μm. (h) Immunoblots (left) of islets transduced with control siRNA (CTR) or CTCF siRNA. Islets were pooled from four wild-type mice. (i) Perifusion analyses of dynamic glucose-stimulated insulin secretion (left) and biphasic insulin release levels (right) of mouse islets as described in h. Islets were pooled from four wild-type mice. Data represent mean ± SD; n = 3 technical replicates; ***, P < 0.001; two-tailed unpaired Student’s t test. (j) GSIS of Min6 cell lines transduced with lentivirus delivering Cas9 and either control (Vec) or CTCF targeting (CTCF-gRNA#1–3) sgRNAs. Data represent mean ± SEM (n = 3); **, P < 0.01; ***, P < 0.001; two-way ANOVA. All panels report data verified in at least two independent experiments. Source data are available for this figure: SourceData F5.

