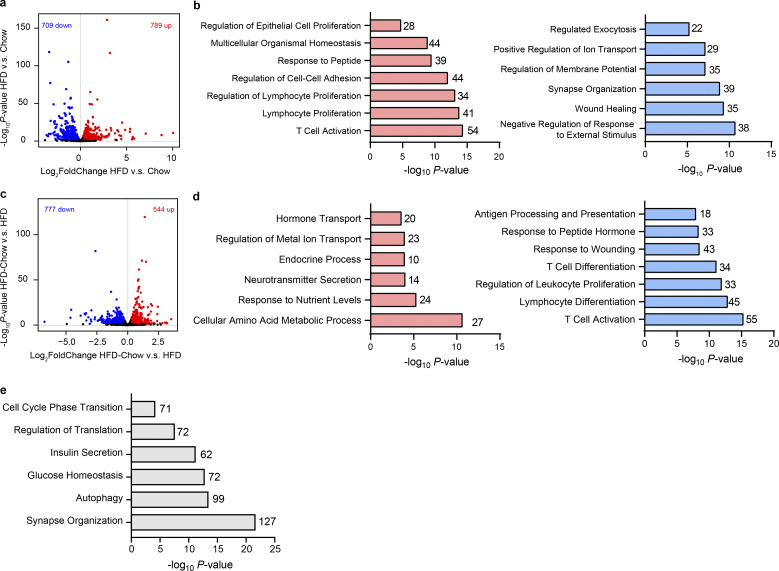
Figure S2.
Pairwise gene expression comparison of bulk islet RNA-Seq data among Chow, HFD, and HFD-Chow groups. (a) Volcano plot showing the gene expression difference in islets between Chow and HFD groups. Genes that are significantly upregulated (log2FC > 0.4, P < 0.05, P values by Wald test) or downregulated (log2FC < −0.4, P < 0.05, P values by Wald test) were marked in red and blue, respectively. (b) GO analysis of significantly upregulated (left) and downregulated (right) genes by HFD compared to Chow group. (c) Volcano plot showing the gene expression difference in islets between HFD and HFD-Chow. Genes that are significantly upregulated (log2FC > 0.4, P < 0.05, P values by Wald test) or downregulated (log2FC < −0.4, P < 0.05, P values by Wald test) were marked in red and blue, respectively. (d) GO analysis of significantly upregulated (left) and downregulated (right) genes by HFD-Chow compared to HFD group. (e) GO analysis of genes unaltered by dietary intervention (|log2FC (HFD-Chow vs. Chow)| > 0.4, P < 0.05 AND NOT Reversible Genes). In a–e, islet samples were pooled from at least three animals. In b, d, and e, most significant and nonredundant biological processes with respective gene number and P value are shown.

