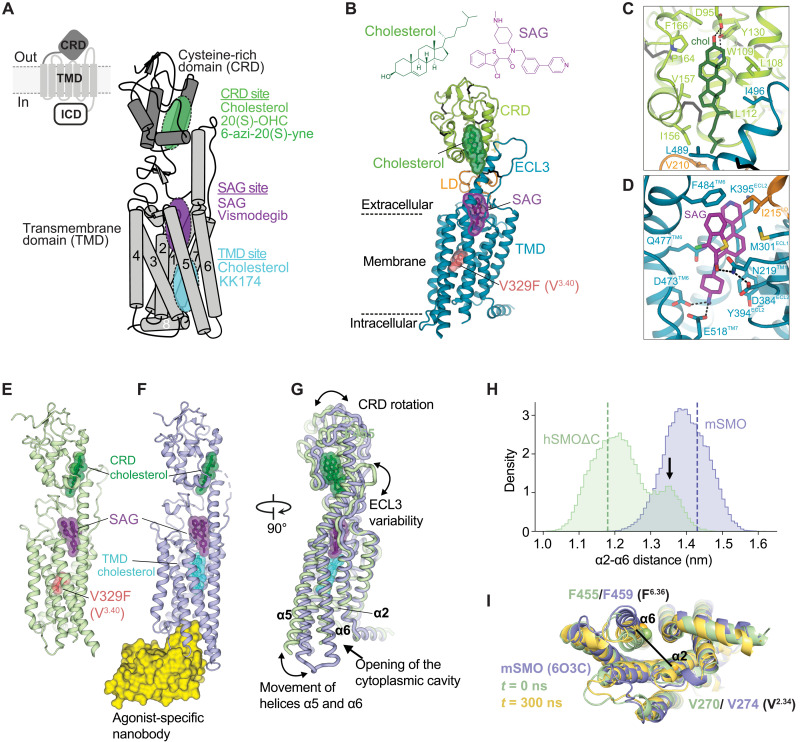
Fig. 1. Multiple ligand-binding sites control SMO activation.
(A) SMO is composed of a CRD, TMD, and intracellular domain (ICD). Schematic of mSMO highlighting three ligand-binding sites (the CRD, SAG, and TMD sites) along with interacting ligands. (B) Structure of hSMOΔC-BRIL-V329F in complex with cholesterol and SAG, with close-ups shown in (C) and (D). (E to G) Superposition (G) of the hSMOΔC-BRIL-V329F:cholesterol:SAG complex (E) with the complex of mSMO with SAG, cholesterol, and a nanobody (Nb8) (PDB 6O3C, 13) (F). (F) is considered an active-state SMO structure. (H) Histogram of the distances between the Cα atoms of hSMO V270 (V2.34) on helix α2 and hSMO F455 (F6.36) on helix α6 in atomistic simulations of mSMO (blue) and hSMOΔC (green), each bound to SAG and CRD cholesterol. Dashed lines indicate the starting α2 to α6 distances, and the arrow indicates the increased distance between α2 and α6 caused by outward movement of α6 (fig. S1). (I) Snapshots showing the outward movement of α6 in hSMOΔC (yellow, fig. S1D). The structure in green shows the distance between α2 and α6 at the start of the hSMOΔC simulation, and the structure in blue shows active-state mSMO [Protein Data Bank (PDB) 6O3C] (fig. S1).

