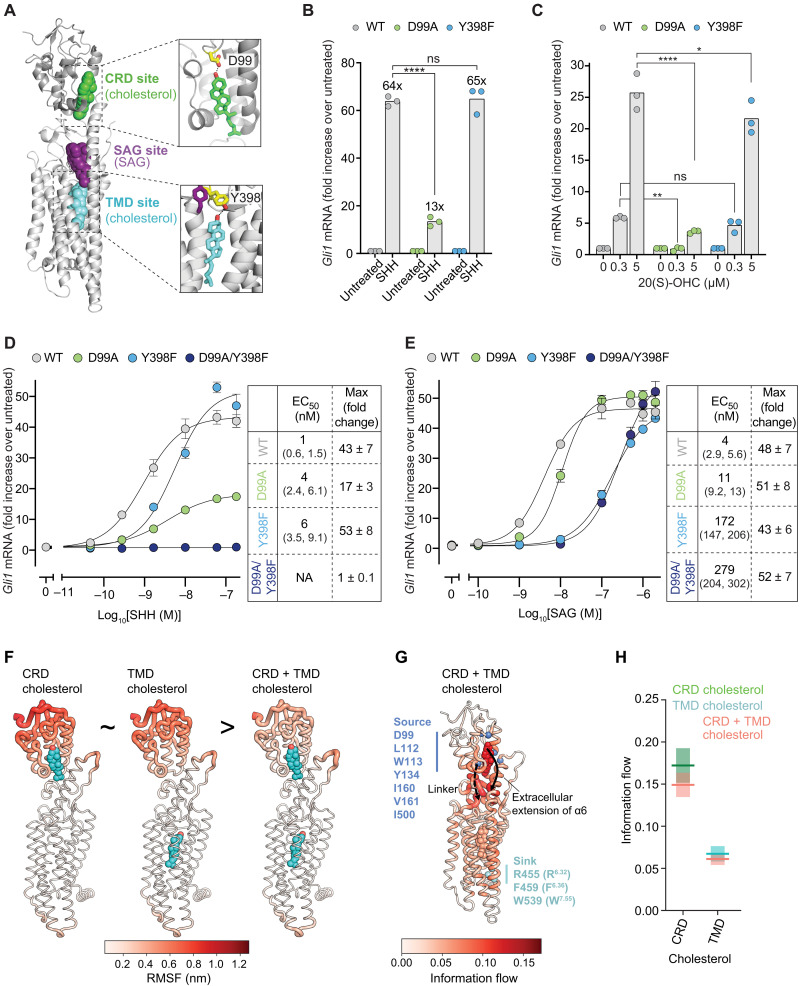
Fig. 2. The CRD mediates the fold increase in SMO activity triggered by SHH.
(A) Close-ups of cholesterol bound to the CRD and TMD sites of mSMO (PDB 6O3C). D99 in the CRD and Y398 in the TMD make hydrogen bonds with the 3β-hydroxyl of cholesterol. (B and C) Fold change in endogenous Gli1 mRNA abundance in response to SHH (50 nM for 20 hours) (B) or 20(S)-OHC (20 hours) (C) in Smo−/− cells stably expressing the indicated mSMO variants. ns, not significant. (D and E) Dose response curves for SHH (D) and SAG (E) in Smo−/− cells stably expressing the indicated mSMO variants (20 hour treatment). Tables list the EC50 (with 95% confidence intervals) and the maximum fold change (with SEM). NA, not applicable. (F) RMSF in residues of mSMO bound to the indicated ligands during simulations are mapped onto the mSMO structure and colored from low (white) to high (red) fluctuation. (G) Information flow from source residues lining the CRD pocket (blue) to sink residues on α6/7 (cyan) is colored from regions of low (white) to high (red) information flow. Cholesterol molecules are also colored on the basis of information flow. (H) Information flow through the cholesterol molecules in simulations of mSMO initiated with cholesterol bound to the CRD alone, the TMD alone, or both. Exact P values for comparisons: (B) WT versus D99A (+SHH) < 0.0001 and WT versus Y398F (+SHH) = 0.7545. (C) WT versus D99A [0.3 mM 20(S)-OHC] = 0.0057, WT versus D99A [5 mM 20(S)-OHC] < 0.0001, WT versus Y398F [0.3 mM 20(S)-OHC] = 0.7891, and WT versus Y398F [5 uM 20(S)-OHC] = 0.0399. Experiments shown in (B) to (E) were performed three different times with similar results.

