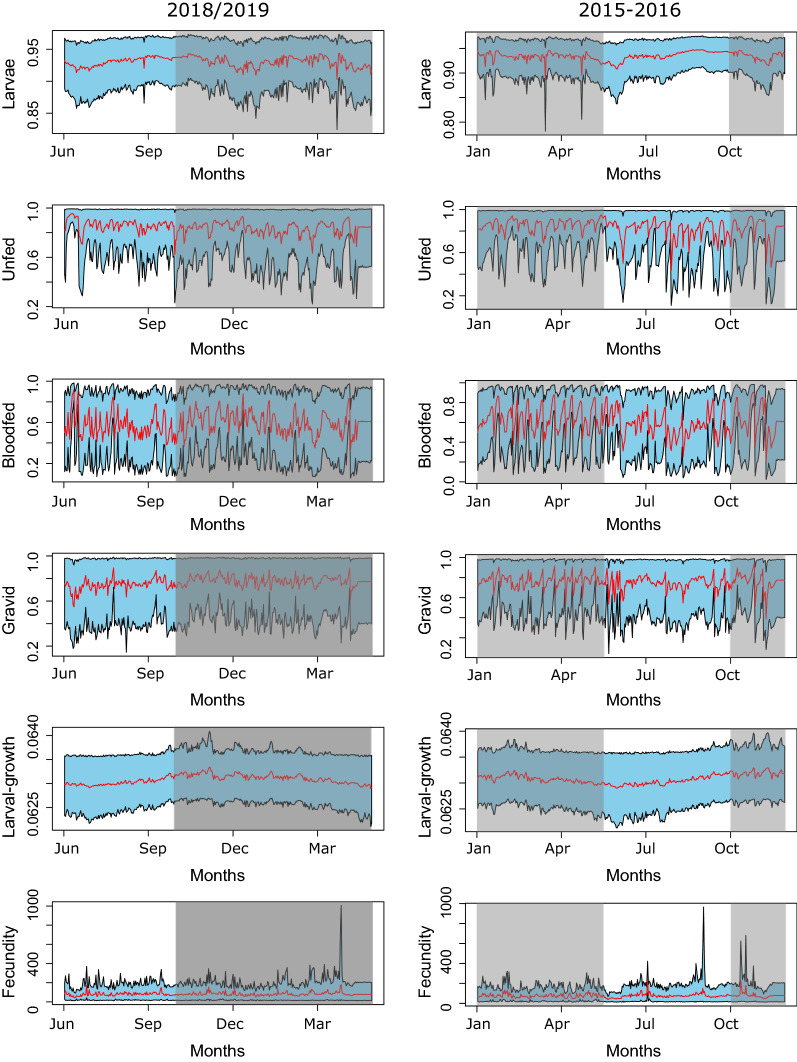
Fig. 5.
Reconstruction of the survival trajectories for all the four stages (larvae, unfed, bloodfed, and gravid) which were affected by the environmental covariates. The two bottom rows show the larval development period and fecundity trends. Left column (a, c, e, g, i, k) is trajectories from June 2018 to May 2019 and right column (b, d, f, h, j, l) is from Jan-Dec 2015. Grey area is the period with rainfall. Y-axis shows the survival rates of different life stages and the bottom row (k, l) shows per-capita fecundity

