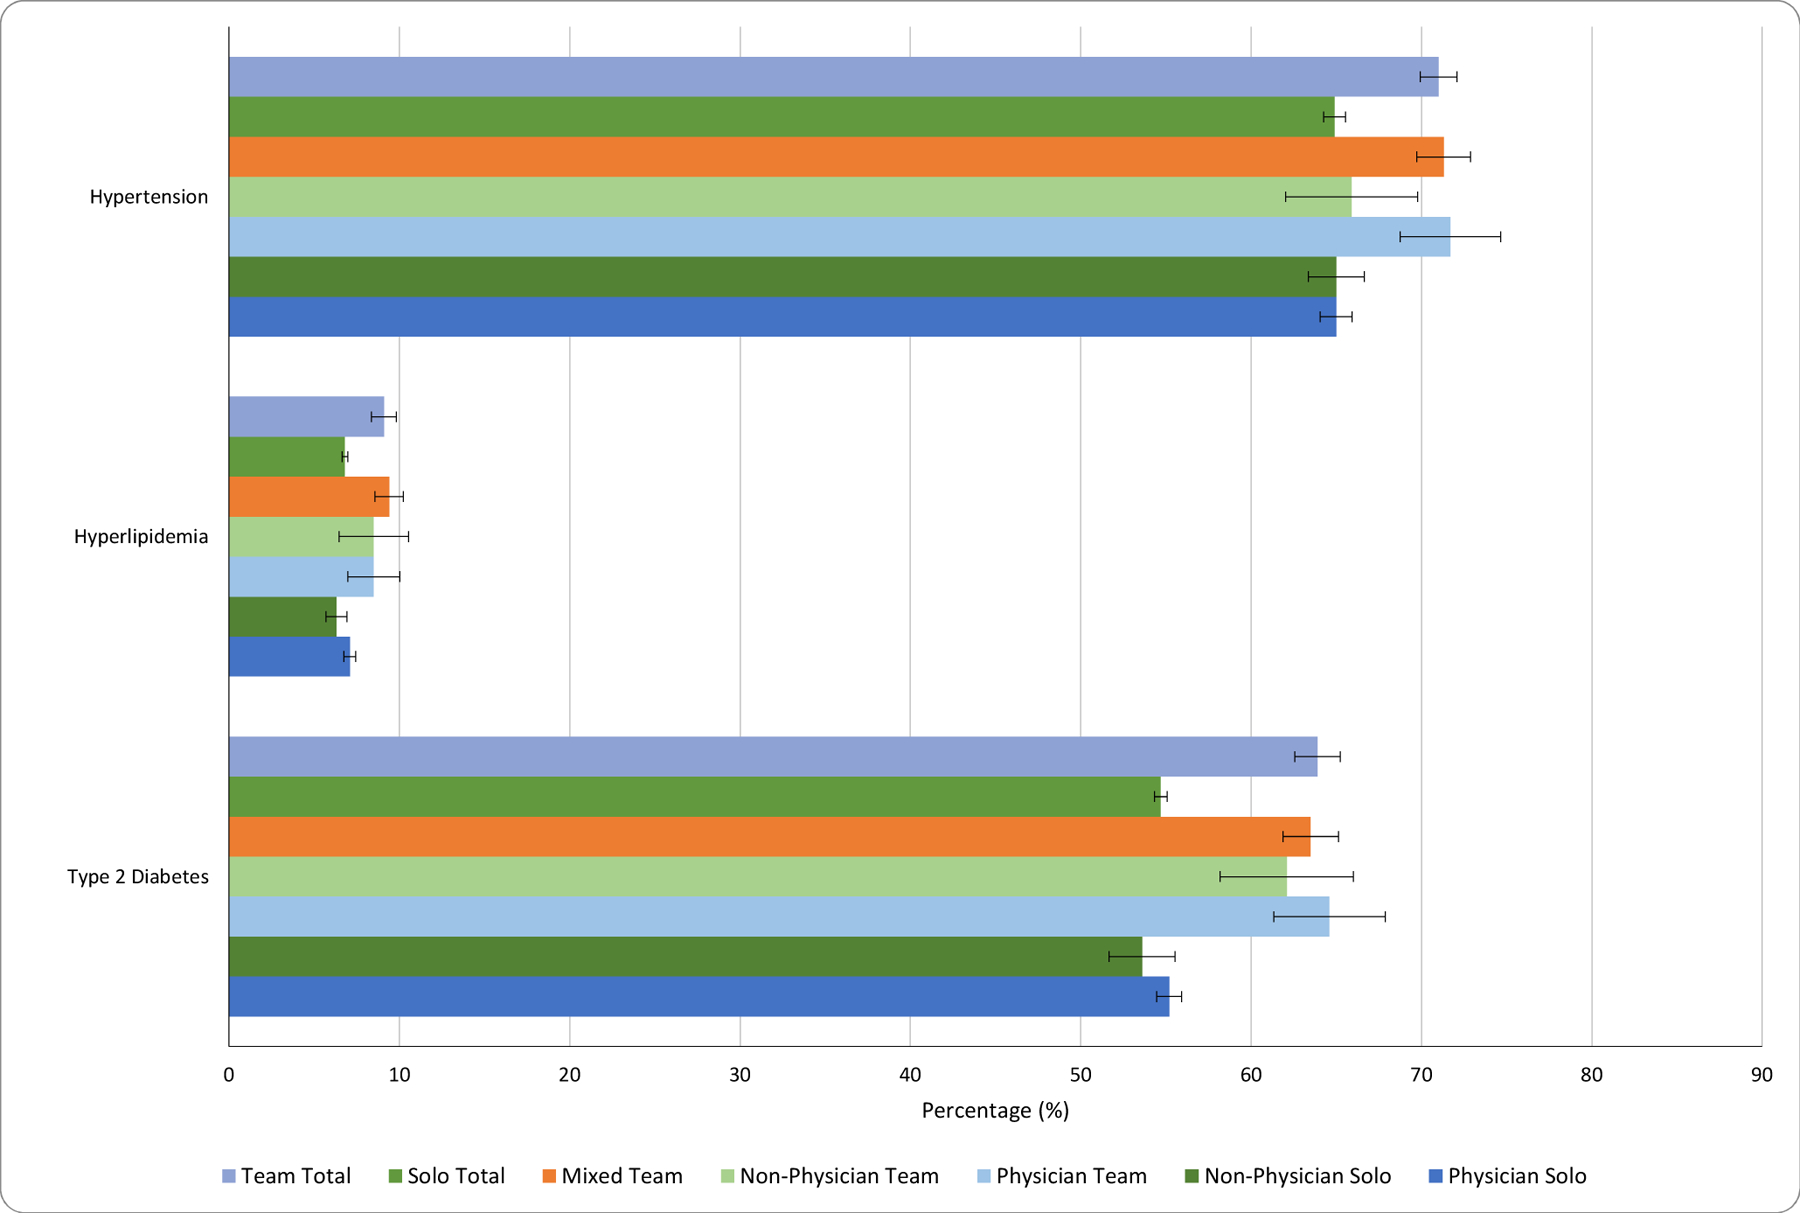
Exhibit 4. Adjusted biomarker-based disease control outcomes for patients with new onset of type 2 diabetes, hyperlipidemia, and hypertension by team-based care and provider type, 2013–2018.

Source: Authors’ analysis of de-identified electronic health record data from 2013 to 2018 for adults with a new chronic disease as identified by an abnormal biomarker (N = 22,874 for type 2 diabetes, N = 24,510 for hyperlipidemia, and N = 28,078 for hypertension).
Notes: Colored bars indicate the predicted values from a regression of disease control, as measured by disease-specific biomarker levels below guideline-concordant biomarker targets within one year, on provider, including organization fixed effects as well as patient and disease severity covariates as described in the text. Error bars represent 95% confidence intervals. p-values for team total vs. solo total were as follows: diabetes, <0.001; hyperlipidemia, <0.001; hypertension, <0.001. Non-physician providers are physician assistants and nurse practitioners. A mixed team is composed of both physician and non-physician providers.
