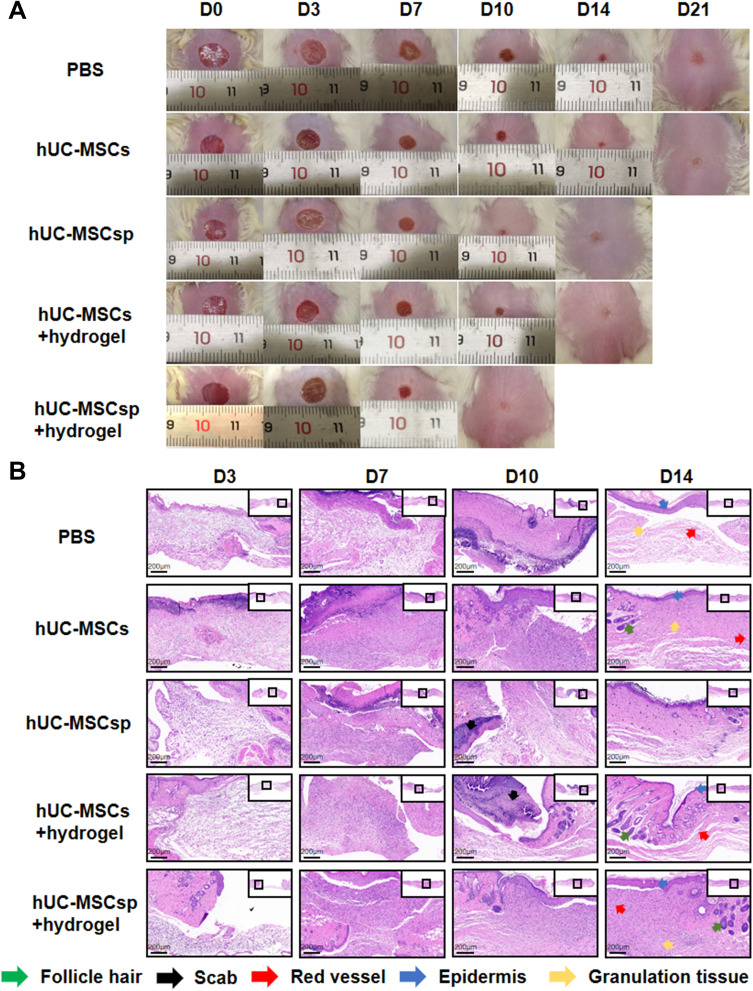
Figure 4.
Wound healing behaviors with different treatments. (A) Representative photo micrographs of wounds when treated with different treatments administered for various durations. The inner diameter of initial wound was 8 mm. (B) Hematoxylin and eosin (H&E) stained images of wounds with different treatments after 3, 7, 10, and 14 days. Green arrow: follicle hair, black arrow: scab, red arrow: red vessel, blue arrow: epidermis, and orange arrow: granulation tissue. Scale bar: 200 µm.

