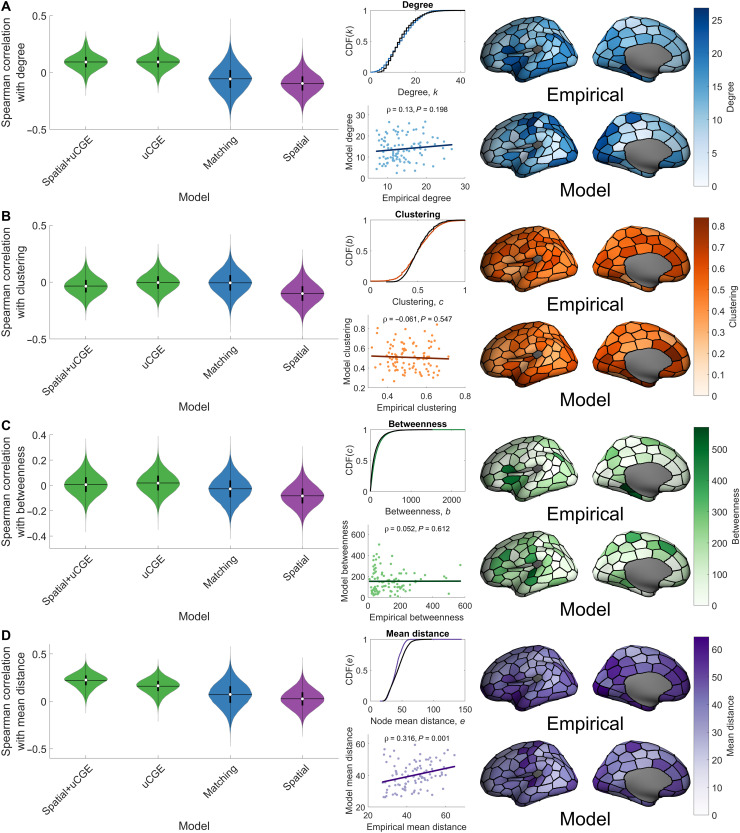
Fig. 5. Model performance in capturing connectome topography.
For each of the network measures that were used to evaluate model performance, we show violin plots of the Spearman correlation between the empirical and data for selected models for a given property of the model fit function. For the spatial+uCGE model, we additionally show, for each network measure, the average cumulative distribution function (CDF) of the model data (colored line) as compared to the empirical data (black line), a scatterplot of average nodal model values against average nodal empirical values, and a projection of these across-individual average nodal measures onto the cortical surface. The Spearman correlation between the empirical and model data is reported above each scatterplot. (A) Spatial topography of node degree. (B) Spatial topography of node clustering. (C) Spatial topography of node betweenness. (D) Spatial topography of mean node connection distance.

