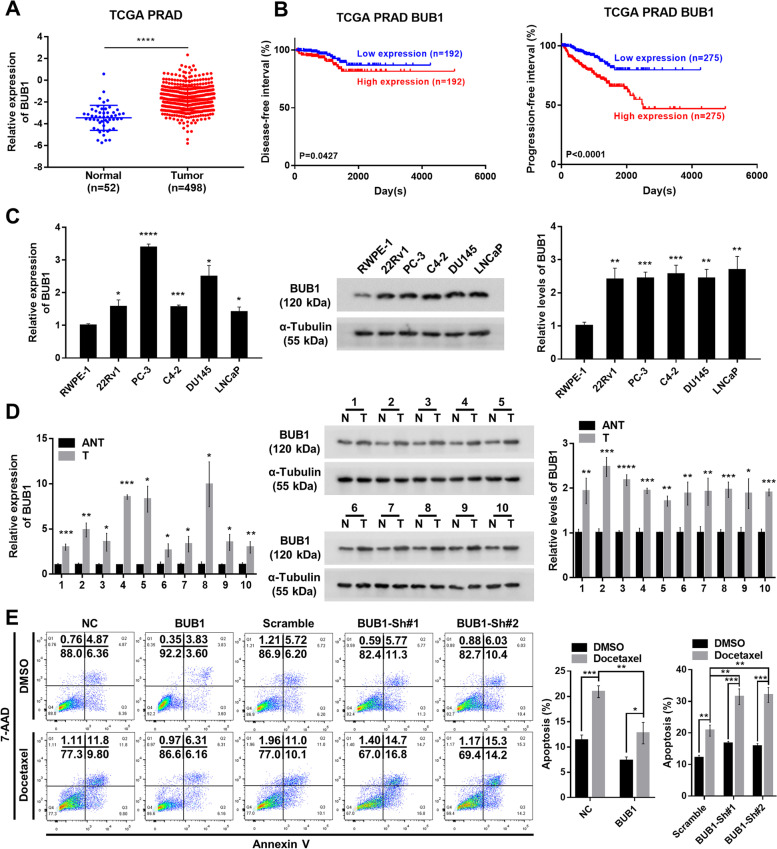
Fig. 6.
BUB1 enhanced the docetaxel resistance in PCa cells. (A) The expression pattern of BUB1 in TCGA PRAD database. (B) Kaplan–Meier analysis of disease-free interval (Left) and progression-free interval (Right) in PCa patients with high or low expression of BUB1. (C) Relative mRNA (Left) and protein (Right) levels of BUB1 in human prostatic epithelial cell line (RWPE-1) and PCa cell lines (22Rv1, PC-3, C4-2, DU145, and LNCaP). GAPDH and α-Tubulin were used as internal controls. (D) Relative mRNA (Left) and protein (Right) levels of BUB1 in 10 pairs of PCa and adjacent normal tissues. GAPDH and α-Tubulin were used as internal controls. ANT/N, Adjacent normal tissues; T, Tumor tissues. (E) The apoptosis rate of PCa cells expressing different BUB1 levels measured by flow cytometry. Cells were treated with 5 nM DTX for 48 h in this experiment. Cells went through the early apoptosis were marked with Annexin V-PE + /7-AAD-, cells went through the late apoptosis were marked with Annexin V-PE + /7-AAD + . NC, Negative Control. Statistical analysis is shown on the bar graphs. Data are presented as the mean ± SD of three independent experiments. * P < 0.05, ** P < 0.01, *** P < 0.001, **** P < 0.0001

