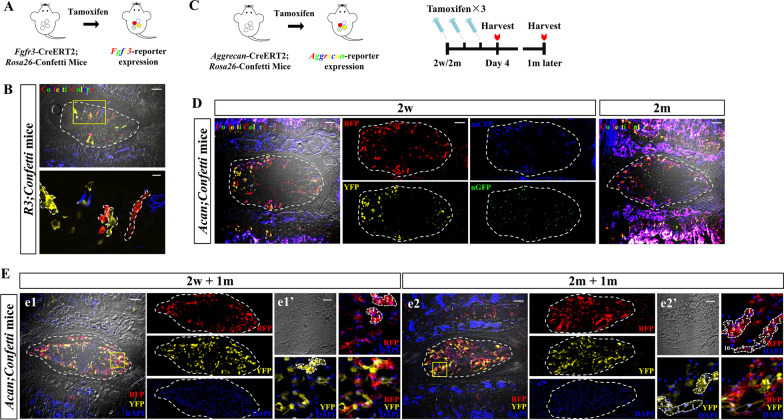
Fig. 5.
Clonal analysis by Confetti system reveals a unique growth pattern of postnatal NP cells. (a) Schema shows FGFR3-CreERT2;Rosa26-Confetti (FGFR3;Confetti) mice following Tam induction to achieve multicolor labeling. (b) Representative images from FGFR3;Confetti mice analyzed at 4 m after low-dose Tam injection (Tam × 1) at P7 are shown. Single-colored cell columns are found arranged along the radius axis of NP (dotted circle). Yellow box areas in the images (scale bars, 100 µm) are amplified below (scale bars, 20 µm). Typical columns are outlined in the amplified images. (c) Schemas show multicolor lineage-tracing strategy of Aggrecan-CreERT2;Rosa26-Confetti (Acan;Confetti) mice used to confirm the postnatal clonal pattern of NP cells. (d) Representative images show that massive NP cells are labeled with different colors in Acan;Confetti mice after Tam-induced recombination at both 2w and 2 m. Individual channels (RFP, mCFP, YFP, nGFP) are shown on the right of the merged image from 2w-pulsed Acan;Confetti mice. Scale bar, 100 µm. (e) After 1 m of tracing, representative images from both 2w-pulsed and 2 m-pulsed Acan;Confetti mice following DAPI staining are presented. RFP, YFP and DAPI channels are shown individually on the right of the merged images (e1, e2), respectively. Yellow boxed areas in (e1) and (e2) (scale bars, 100 µm) are shown at a high magnification in (e1′) and (e2′), respectively (scale bars, 20 µm). Single-colored cell clusters are found in both 2w-pulsed and 2 m-pulsed NP (dotted circle). Typical cell clusters in e1′ and e2′ are outlined, respectively. The cell numbers of each cell clusters are annotated in the dotted outlines

