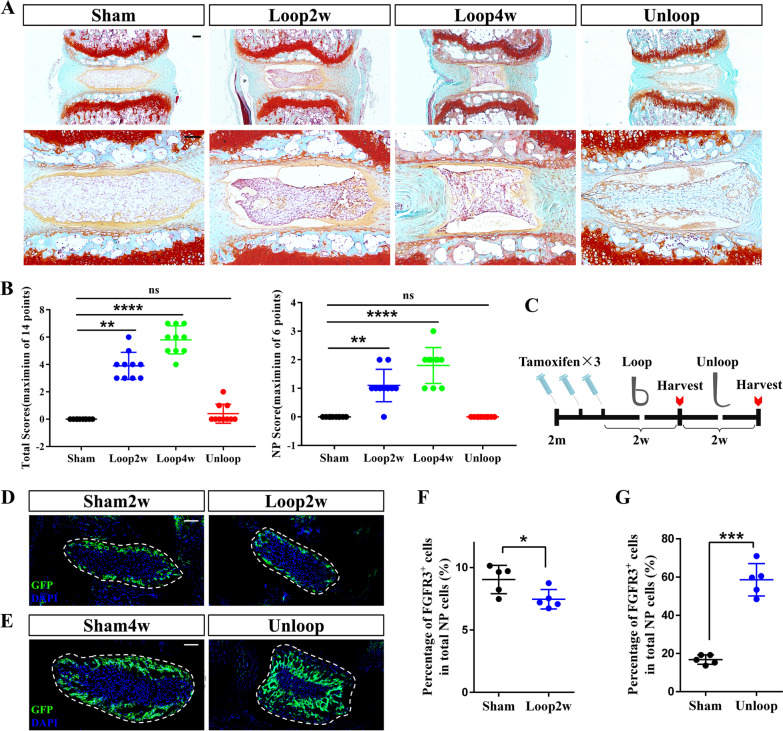
Fig. 6.
Tail-looping experiment reveals extensive expansion of FGFR3+ NP cells during regeneration. (a) Representative Safranin O/Fast Green staining images of each group of tail-looping models show the pathological changes after overloading and recovery. Scale bars, 100 µm. (b) Pathological scoring of NP and total IVD of each group is assessed and compared. ns = no significance, **P < 0.01, ****P < 0.0001, One-way ANOVA with post hoc Tukey test. (c) Experimental design shows that tail-looping model was generated using FGFR3;mTmG mice after Tam administration. (d, e) Representative NP (dotted circle) images from FGFR3;mTmG mice after looping and unlooping as well as the sham operation are shown. Scale bars, 100 µm. (f) The percentage of the FGFR3+ NP cells in total NP cells in Group Loop2w is lower than that in Group Sham2w. *P < 0.05, Unpaired Student’s t test. (g) The percentage of the FGFR3·+ NP cells in total NP cells in Group Unloop is significantly higher than that in Group Sham4w. ****P < 0.0001, Unpaired Student’s t test

