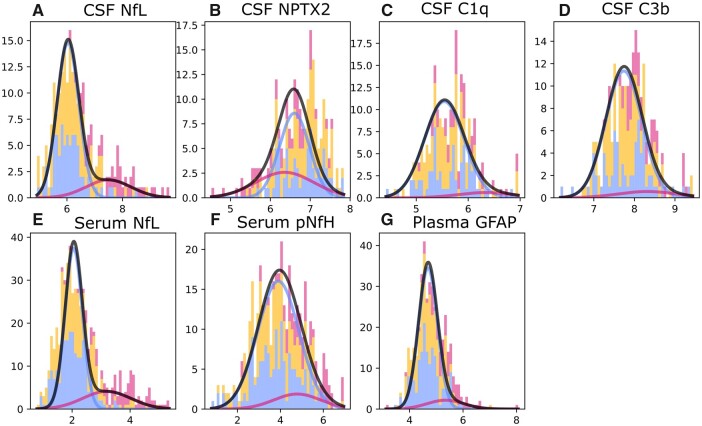
Figure 1.
GMM distributions for each biomarker. Histogram bins are shown for non-carriers (blue), presymptomatic carriers (orange) and symptomatic carriers (dark pink). The blue Gaussian represents the distribution of normal biomarker values based on non-carriers, whereas the dark pink Gaussian shows the distribution for abnormal biomarker values, as estimated by GMM. The amplitudes of these Gaussians are based on an estimated mixing parameter. Black curves show the total estimated biomarker distribution, i.e. the summation of blue and dark pink Gaussians, and indicate the overall fit of the estimated Gaussians to the observed data. All biomarker values were log-transformed.

