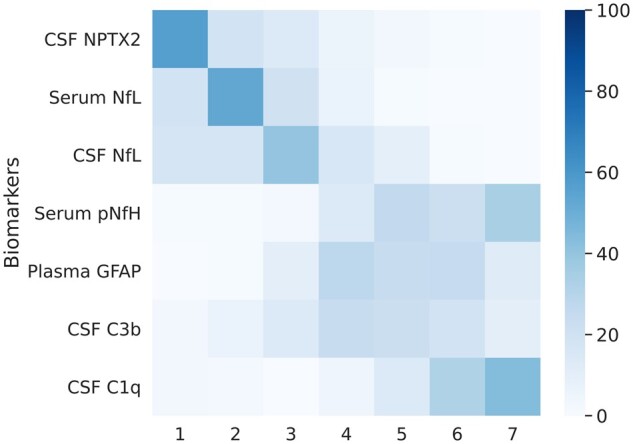
Figure 2.

Positional variance diagram showing the sequence of biomarker abnormalities. The colour intensity of each of the squares represents the number of bootstrap resampling iterations in which the biomarker was placed at a certain position. The darkest square for each biomarker therefore signifies the mode, i.e. the position where the biomarker was placed most frequently. The spread obtained from bootstrap resampling represents the standard error of the distribution and signifies uncertainty in the estimation of the ordering. The ordering of biomarkers is based on their position in the entire dataset (without bootstrap resampling), which is akin to mean position.
