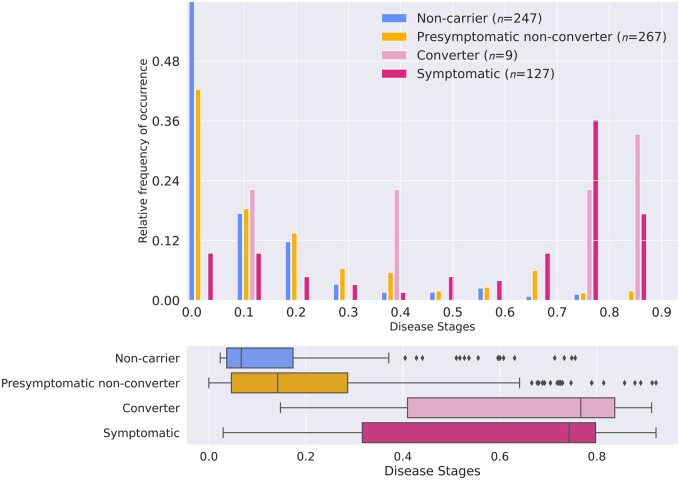
Figure 3.
Estimated disease stages per clinical group. Disease stages were obtained using 10-fold cross-validation. (A) Histogram showing the frequency of occurrence of each of the disease stages per clinical group, normalized for each clinical group. Estimated disease stages are a continuous measure and were discretized for visualization purposes only. (B) Box plots of estimated disease stages for each clinical group. Box plots indicate median ± IQR; whiskers indicate median ±1.5× IQR. Symptomatic carriers and converters had higher estimated disease stages than presymptomatic non-converters (P < 0.001 and P = 0.004 respectively), but no difference was found between symptomatic carriers and converters (P = 0.712) (by Kruskal–Wallis tests).

