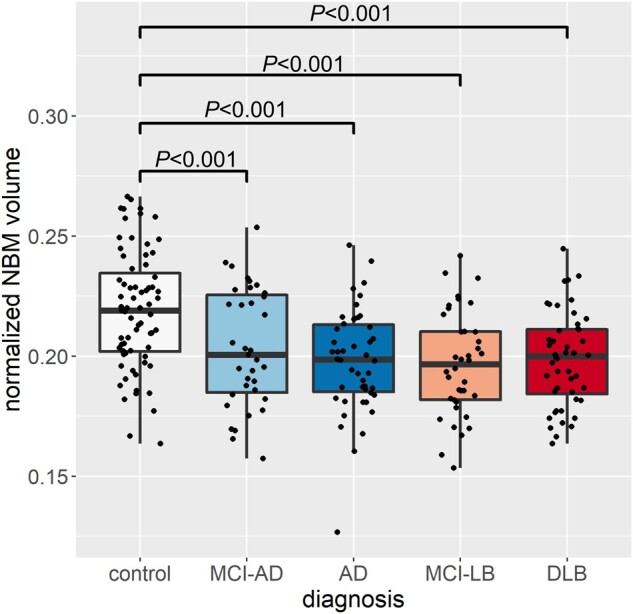
Figure 3.

Group comparison of normalized NBM volume. In each box plot the central line corresponds to the sample median, the upper and lower border of the box represent the 25th and 75th percentile, respectively, and the length of the whiskers corresponds to 1.5 times the interquartile range. P-values result from pairwise post hoc tests with Bonferroni correction for multiple comparisons. All P-values for comparisons that are not shown are >0.05. AD = Alzheimer’s disease dementia.
